(Last updated: 10/18/2019 | PDF | PERSONAL OPINION)
Like “Open”, “Platform” is yet another loaded and universally abused term. While every vendor claims their offerings to be the platform, what does an ideal analytics platform entail, from user’s point of view?
A Reference Model for Analytics Platform
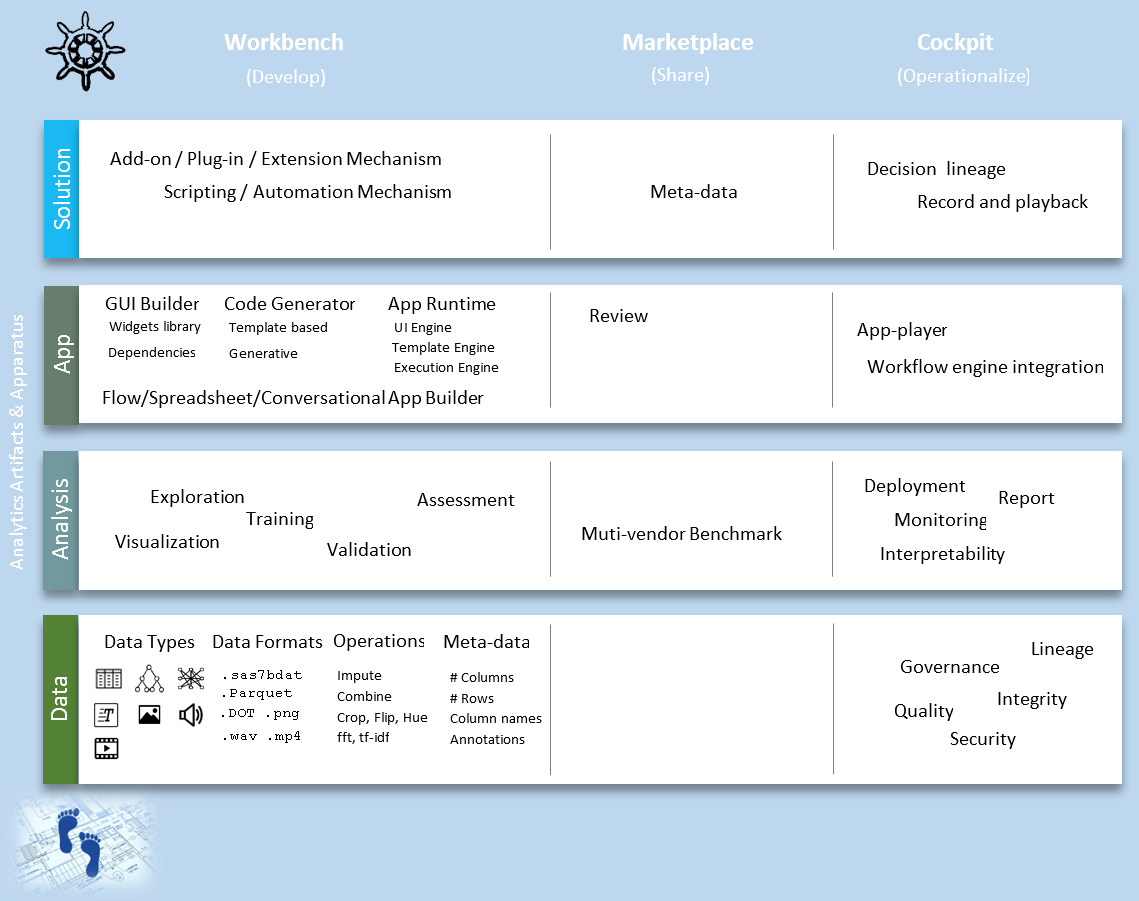
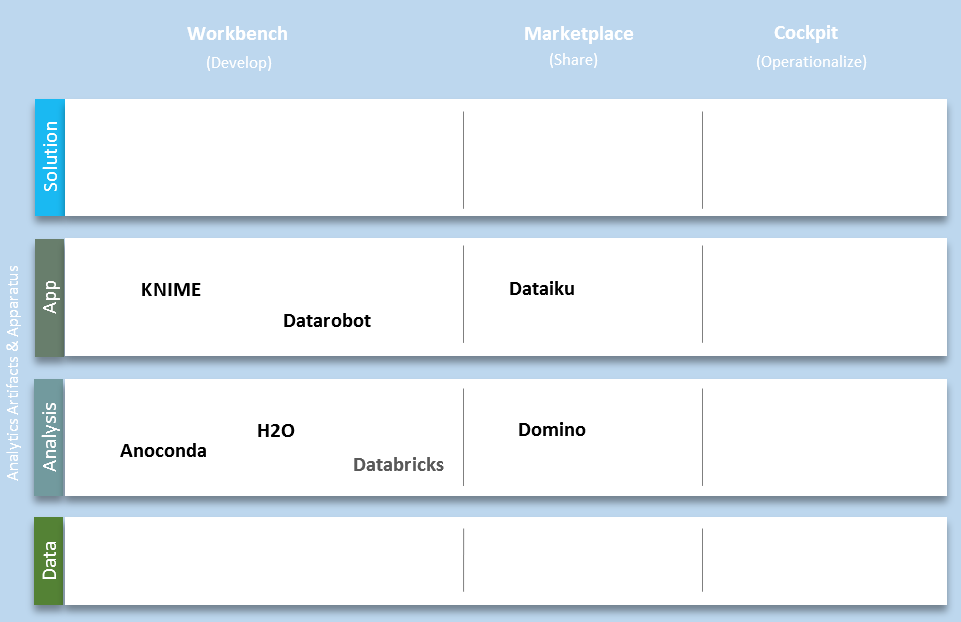
If you look closely at any of a decent sized enterprise at a specific time, you’ll notice that their analytical activities are clustered around four different types of analytical artifacts which I call the Analytical Stack. If you look closely at the enterprise over time, you’ll notice each analytical artifact goes through different focal points over their lifecycle. The ideal analytics platform can be naturally arranged in a matrix form as shown below.
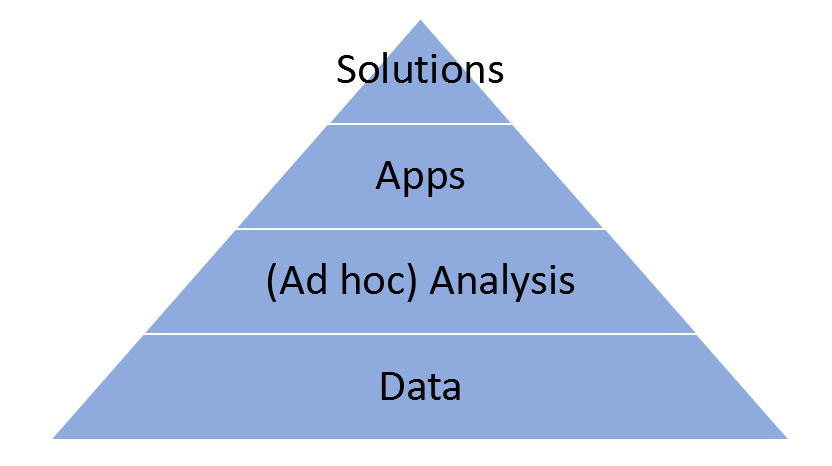
The Analytical Stack
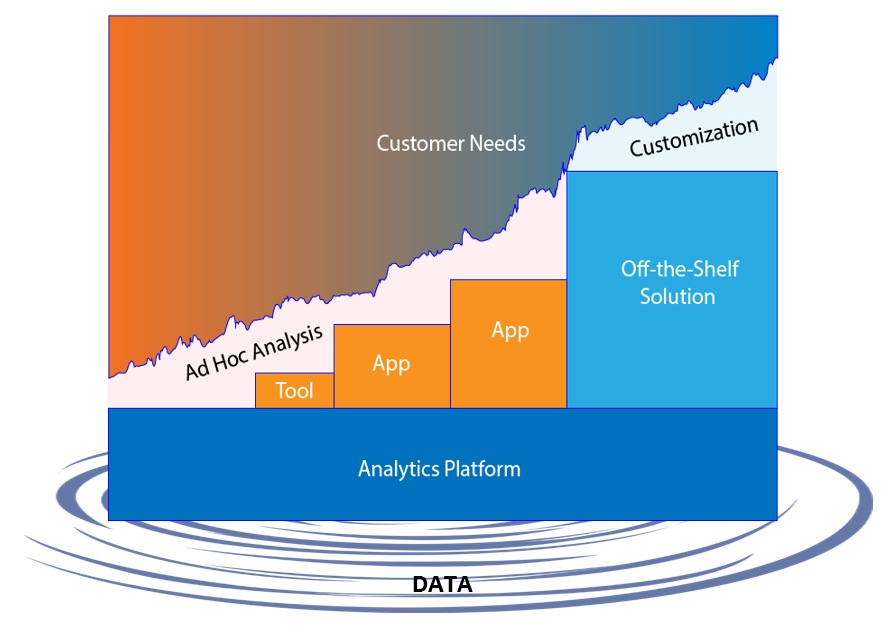
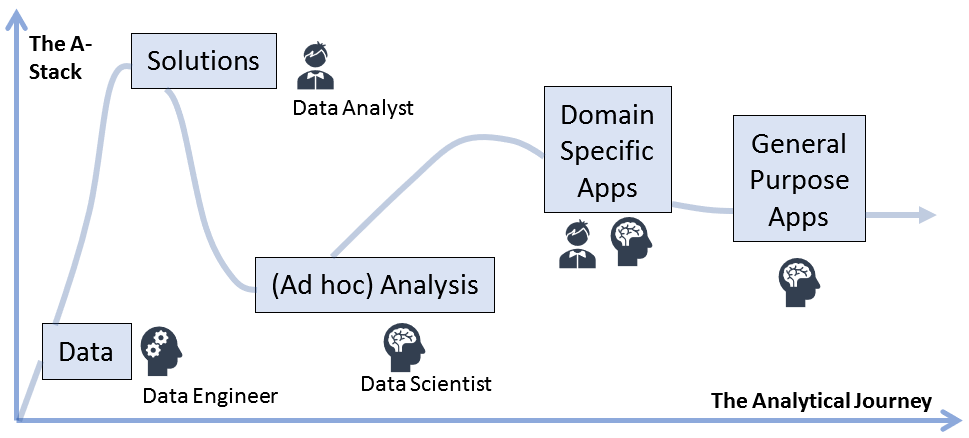
Data, (Ad hoc) Analysis, Apps and Solutions are the four layers in the analytical stack. Since customer’s needs are continuous, but functionalities offer by apps and solutions are discrete, ad hoc analysis and customizations are a must to fill the gaps in between. Analytics Apps framework (Dash for Python and Shiny for R) and the needs they’re serving deserves special attention as the submarkets are moving away from off-the-shelf domain specific apps to customizable general-purpose apps.
The lower in the analytical stack, the more activities occur, and the more efforts are spent. The most dramatic example is that 80% of the data science project was spent in data manipulation, the bottom layer of the stack.
Enterprises don’t build up their analytical stack in a linear fashion. Inundated with data, they normally start with buying off-the-shelf solutions from vendors to derive value. As uncovered edge cases surface up and the need to cook their own secret sauce grows, enterprise starts to build up their data scientist team, whose members are capable of operating specialized domain specific apps and develop customized apps for internal users.
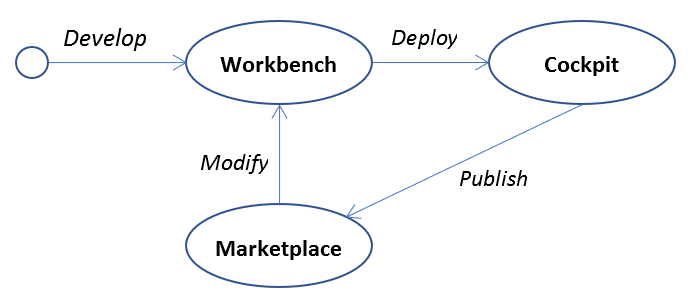
The Analytical Focal Points
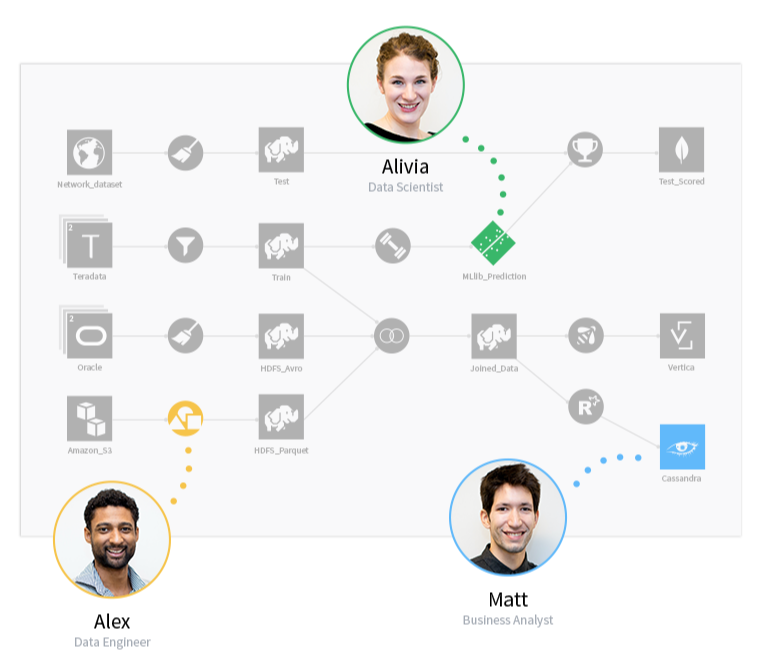
Analytics activities in an enterprise are centered around three focal points: The Workbench, the Marketplace and the Cockpit, which maps to three basic operations of almost anything: develop, share and deploy.
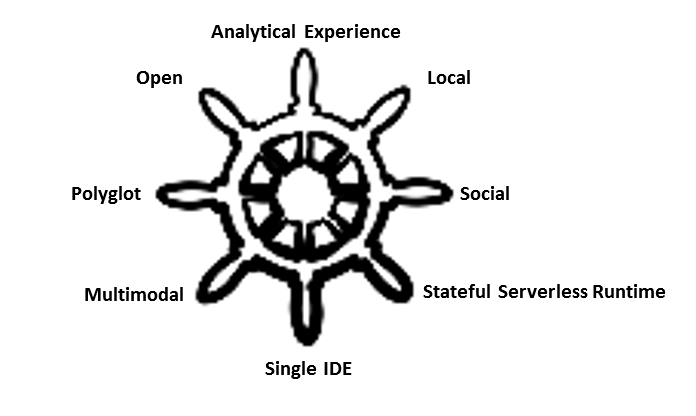
Desirable Traits of Analytics Platform
The list of desirable traits of an ideal analytics platform is long and evolving…
Analytical Experience (AX)
For any analytics vendor, if you cannot win on price, you must win on innovativeness. If you cannot win on innovativeness, good analytical experiences are your last defense. We saw this played out in the IDE space: The expensive Microsoft Visual Studio used to the enterprise choice, then the free open sourced Eclipse, then IntelliJ IDEA wowed everybody with its developer experience and then Microsoft got its mojo back with the free and open sourced Visual Studio Code. Today, at where I work, we’re still willing to pay money to use IntelliJ, even though Visual Studio Code is more than adequately good. With its great developer experience, IntelliJ certainly earned a lot of loyalty.
Open
By definition “platform” has everything on top of it. If commercial analytical vendors open only one-way to the outside world, i.e. allowing Open Source Software (OSS) to use their stuff but not the other way around, they’re conceding the analytics platform crown to vendors who support two-way integrations between commercial and open source software.
Semantic
Semantic means machine processible knowledge, which is normally based on a domain specific ontology. When user does a name search on “predictive analytical models” on the analytics platform, it should return all matching REGRESSION and SVM projects. Because somewhere in the analytics ontology, there are two tuples that say: “REGRESSION, is_a, predictive analytical model” and “SVM, is_a, predictive analytic model”.
The platform level ontology and knowledgebase enable development of apps and solutions that exhibits human intelligence such as writing and conversations.
Local
The analytics platform should be aware of who did what on which at when and inform me when I need to do similar things. “Local” here is task local rather than geographically local. If I am tasked to relabel observations in Medicare Part D prescription data based on custom age ranges, I’d like to know the folks who worked with the same data or even better the person who worked with the same variable that I’m going to use. If it’s Susan over the other end of the world, she’s local to me.
For a given analytical artifact, the analytics platform should be able produce a list of stakeholders of the thing. If I’m noticing one of the models in production is deteriorating in predictive quality, I’d like to know who the developer is for the model or who the owner is for the input data.
Social
I should be able to ping any co-workers, “neighbors” or stakeholders anytime with one of the means provided by the analytics platform.
Mobile
No! It’s perfectly fine for Marissa Mayer to issue the “Mobile First” edict at Yahoo, which is a consumer facing company. But not for analytics. For anybody who want to copy the same mantra at the enterprise facing analytics product, all you need to do is to force the person to carry out one complete data science project exclusively on smart phone. All those efforts wasted on mobile-first or responsive design (form-factor) in analytical solutions could’ve been better spent on improving analytical experience (content).
Polyglot
Different programming languages are suited for different tasks. Different individuals have different preferences for different languages. General purpose, domain specific(DSL), object oriented, functional, visual…, the analytics platform should support multiple programming languages.
As an example, SAS’s Data Step is the best domain specific language (DSL) for non-programmer to process tabular data. Yet, it’s not designed to do and not efficient at doing other things that a general-purpose language such as Python can do.
Multi-Modal
The analytics platform should also support multiple modes of human-analytics interactions: Imperative or declarative programming, computer aided programming by point-n-click manipulation or demonstration… Again, this is because different modes of interactions are suited for different tasks and different individuals with different levels of expertise prefer different modes of interaction.
Single IDE
People are greedy. On the one hand they can’t have enough of the flexibilities provided by polyglot programming and multi-modal interaction, yet at the same time they want the convenience of having to deal with only one single integrated development environment (IDE). While hardcore programmers are happily fighting the Emacs vs Vim editor war, everyday developers are converging on a single free and open source IDE: Visual Studio Code(VS Code).
Developed by Microsoft, VS Code is seeing major adoption at Google. AWS added VS Code integration. The most popular programming languages found their most popular IDE developed as VS Code extensions: Google’s Go, Apple’s Swift, Python, R… Take special note of the last two VS Code extensions, two of the most popular programming languages among data scientists, are officially developed and supported by Microsoft. Microsoft also develops the most popular Python static analysis tool PyRight. If you saw the image of the sweaty Steve Ballmer (Microsoft ex-CEO) chanting “developer, developer, developer”, with dedicated resources put behind Python and R community, it’s clear what’s on Microsoft’s mind: “data scientist, data scientist, data scientist”!
For commercial analytic vendors with its own DSL’s, I suggest they consider expanding their reach to users of the most popular IDE: VS Code.
- Implement the language server protocol (LSP) for proprietary language such as SAS and Matlab. This enables other IDE vendors to provide features such as auto complete, go to definition, or documentation on hover in a standard way.
- Build a VS Code extension for proprietary language such as SAS and Matlab, utilizing the LSP implementation for code editing features and add debugging capability for completeness.
I’m not a maniac here. SAS community members have started talking about developing a VS Code extension for SAS language among themselves.
What about Jupyter Notebook? You may ask. It’s just an amateur environment for education and demoing. As data scientists matured in programming skills, they’ll eventually flock to proper IDE such as VS Code. And it’s just an extension away for VS Code to gain a notebook interface like Jupyter, but not the other way around. As if a testament to my assessment, Anaconda recently included VS Code in its distribution.
Stateful Serverless Runtime
Execution backend never comes to my mind while writing this treatise about platform, probably because I assume that they’re just some sockets in the cloud that I can plug and consume. Serverless? You may think that’s what I’m thinking. Not exactly. In my humble opinion, for analytics tasks, serverless is useless, mostly.
State is the thing that make serverless useless for analytics. In the current maturity level of serverless, “any state of a FaaS function that is required to be persistent needs to be externalized outside of the FaaS function instance.” Do I want to trade this state-externalization mess for the cloud server provisioning and scaling? No.
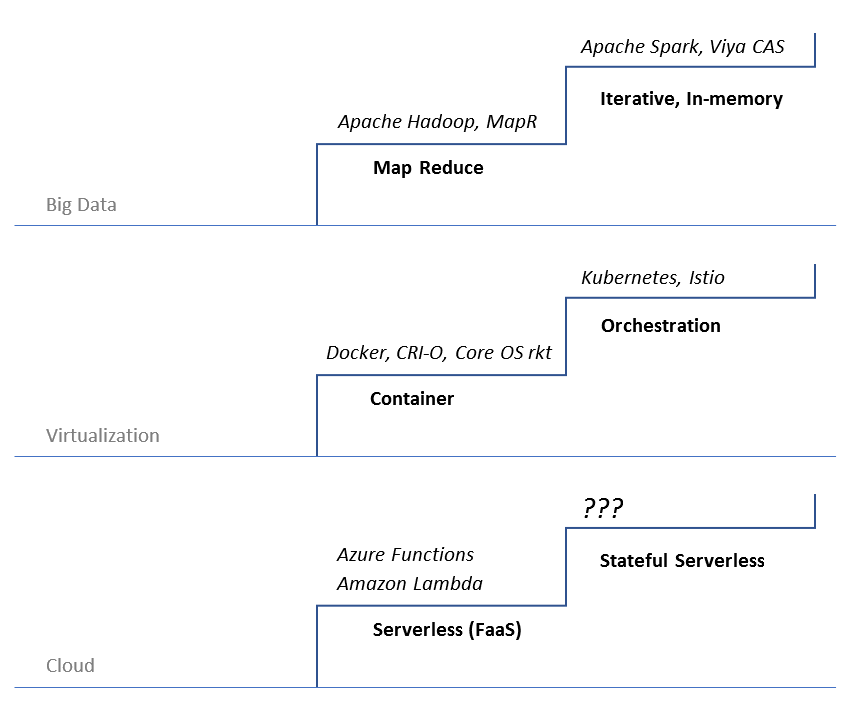
The profit driven AWS doesn’t care about the limitations of serverless. They promote it as the next greatest thing to make profit off the uninitiated. The real deal which is stateful serverless hasn’t arrived yet.
Similar pattern has happened again and again. Looking back, I’m not sure what’s the true motivation when Google’s published the map-reduce paper. Knowing the non-iterative limitation of map-reduce, probably having already built their iterative in-memory analytics engine in house at the time, how do you know Google not promoted map-reduce to mislead the rest of the big data players?
Then there are containers, which is an amazing thing. Google started using it and contributed cgroups to Linux kernel without publicizing it in the mid-2000s (Why not? If Google truly practice altruism). Docker folks discovered the treasure in 2013 and made everybody believe that containerization is the future. But only Google knows at that time that the real deal to make containers work is container orchestration. As Docker came to the same realization later and developed Docker Compose, Google open sourced Kubernetes which effectively kills off Docker Compose and forced Docker to standardize their image format and open source their runtime. Docker is reduced to an indispensable but not money-making player.
I digressed. The point is, when yet another shiny thing comes out of Silicon Valley, we cannot jump on the fleeting bandwagon without evaluating it against our analytical needs.
Don’t say stateful serverless not doable though, look at repl.it(Click the “repl it” button on top right), the single IDE in the browser within which you can instantly spawn and work with any of the 60+ cloud based runtimes, from simple bash shell to full stack react + typescript development and deployment environment. They are the first to come up and materialize the “stateful serverless” concept: “As for our infrastructure, we’re building a new kind of computing platform: it’s Serverless in that users don’t have to care about the underlying resources, but it’s not Serverless in that it’s stateful. This way it’s interactive, and since we’re focused on newcomers, it’s a much more natural programming model. We’re also building a filesystem abstraction that allows your working directory to travel with your container between development and production and as it goes offline and online.”
A Tool for Thinking
Compare the current state of offerings in the market with this reference model of analytics platform, there are gaps and bloats allover. I’ll leave it to you to fill in the blanks. What I do want to point out, though, is the way of thinking or the lack thereof that created these gaps and bloats.
Platform vs Divisional Thinking
Within a commercial analytic platform provider, common functionalities should be built at platform level across the analytical stack. For Marketplace focused features, what we don’t want to do is to build an “exchange” within Product A for A, a “repository” within Product B for B, a “bazaar” within Product C for C and a “Store” within Product D for D… All analytical artifacts, from data to apps to solution extensions, could and should be discovered, reviewed and “purchased” in the same fashion within the same marketplace.

User vs Vendor Thinking
Analytic platform vendors must overcome the instinct of nurturing and promoting their own baby. As one example, the day when SAS Studio or R Studio team builds and publishes a Visual Studio Code extension for the SAS or R language respectively, knowing that’ll greatly reduce the number of SAS/R Studio users, they’re practicing user thinking.
Full Stack vs Layered Thinking
To qualify to be a platform, a vendor must support all activities on all layers of the analytics stack. Take image analysis as an example, the operations around image data, the language and toolchains required to do custom analysis, the pre-built component and apps as well as solutions are all part of the holistic stack that the user needs.
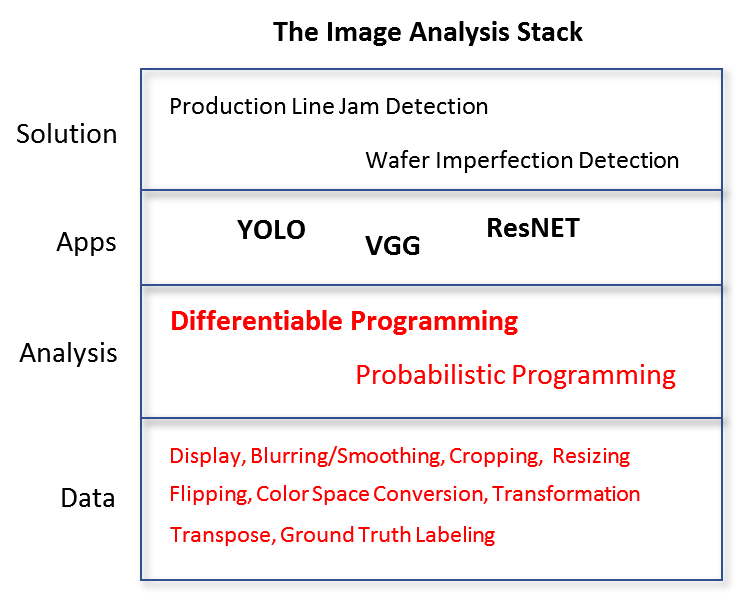
If a commercial image analysis vendor focuses solely on the apps and solution layers and tell customers “you may use open source solutions for data preparation and custom analysis”. The customer would have no choice but think “If we’re forced to adopt open source or other vendors for bottom layers functionalizes, why don’t we adopt them for the full stack?”.
Building on top of open source machine learning frameworks is a quick way for commercial vendors to provide the mundane lower layer functionalities while innovating on the high value-add apps and solutions in the higher layers. Differential and probabilistic programming are the two mainstream paradigms to analyze image data. Leading open source implementations such as TensorFlow, PyTorch, PyMC and STAN offer a modeling system for custom problem definition and automatic solution finding subsystem which enables fast try-and-error model explorations.
More importantly, each open source differential and probabilistic programming systems offers the benefits of an ever-growing community: tutorials, lessons learned, building components…
Full Lifecycle vs Snapshot Thinking
We must consider all the focal points and lifecycle phases an analytical artifact goes through. At the platform level we must consider the tagging and discoverability of things, not only in the marketplace for people to find things but in the cockpit for people to take notes of their usage experience so when the things go back to the workbench they can be improved.
Of course, the most important phase is the development phase, in which we must consider what does the analytical artifact need in the marketplace and in the cockpit.
Design for Serviceability
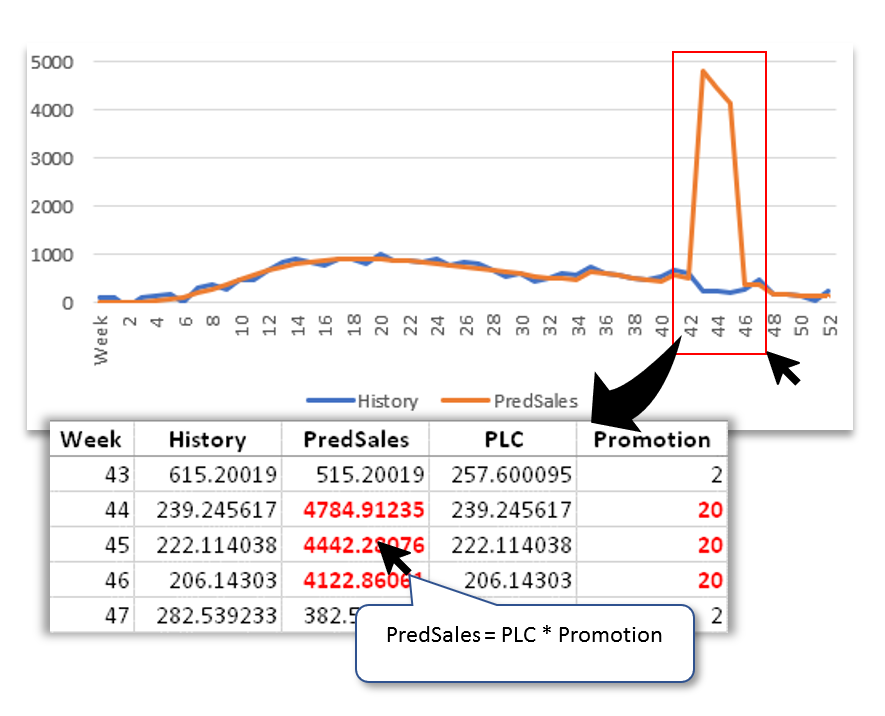
Many customer tickets rooted from data issues may be avoided if solutions provide its “decision lineage” to users: how it carried out the calculation, how it reached to the conclusion… In below forecasting scenario, predicted sales for three weeks clearly go out of band. If the solution empower user to drill down to the problematic weeks and show users how the prediction is calculated, it takes no time for the user to pinpoint the root cause: promotion effects for the three weeks have an extra zero in them, scaling forecast up by 10 times.
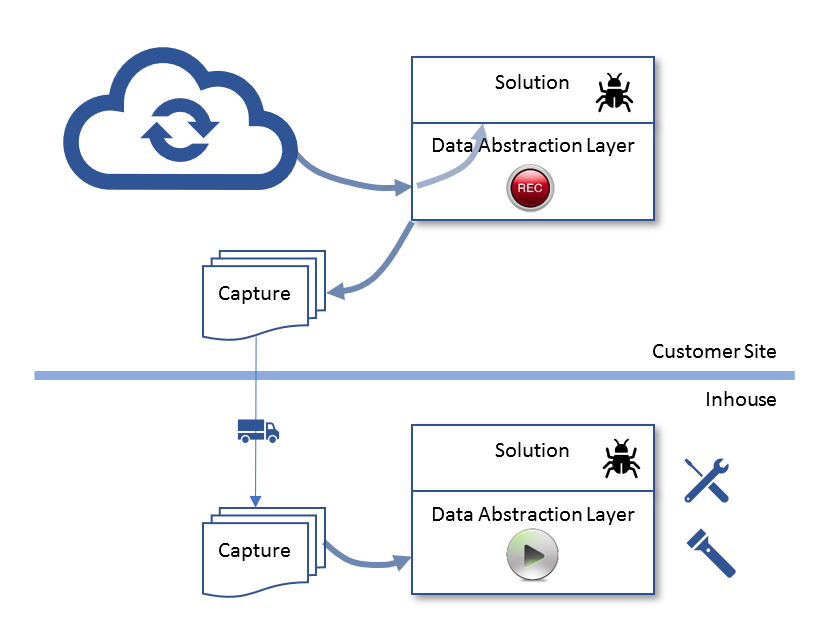
For real defects discovered in the field, debugging can be painful. Have you debugged an application against data in the cloud? I haven’t. But I have debugged into a data center in Texas from an office in Cambridge Massachusetts. The experience was so painful that my team ended up building an “record and replay” component into the data abstraction layer of our solution. When the “Record” button is pushed down by the user at their site, data gets dumped into bunch of CSV files as they flow into the solution, zipped up and shipped to us. We then replay the calculation against the data dump, with the debugger turned on. We even developed Excel tools so users can analyze the data dump and diagnose the problem themselves, before sending tickets our way.
Operationalize the Analytics Team on the Analytics Platform
Ultimately, it’s people who work on the analytics platform, people with different roles, capabilities, personalities and priorities. As much as we need a system like BlueFootprint to manage the “manufacturing” of the analytics platform, our customers need similar system to manage the “operationalizing” of their analytics team on the analytics platform.
As part of the analytics platform, BlueFootprint for Data Science provides preventive quality control, visibility, dynamics control and performance management functionalities customized to data science teams.
Disruption vs Integration
There is nothing disruptive in the reference model of analytics platform, however the devil is in the details. Old guard analytic vendors can still win by taking what those Silicon Valley disruptors come up and meticulously weaving them with their deep understandings of domains and customers. Analytics platform is about integration, the mundane thing those smart Googlers don’t care to do. Whoever is willing to do it, for users, who will win in the end.
Conclusion
The true analytic platform is yet to come and integration of the best of both worlds (OSS and commercial) into one holistic analytic experience is the key to its success. As indicated by the swath of empty spaces in the reference model, the breadth, depth and complexities of analytic platform is beyond a single person, a team or a vendor.
Appendix: The Platform Zoo
Below is a list of players who made it into the Magic Quadrant for data science and machine learning platforms and have an architectural diagram prominently displayed on their webpage. Most of them operates in a single layer of the reference analytics platform.
None of the competitors has the resources and knowhow to build the full-stack analytics platform alone, but there are some good ideas we all can learn: collaborative, unified, open…
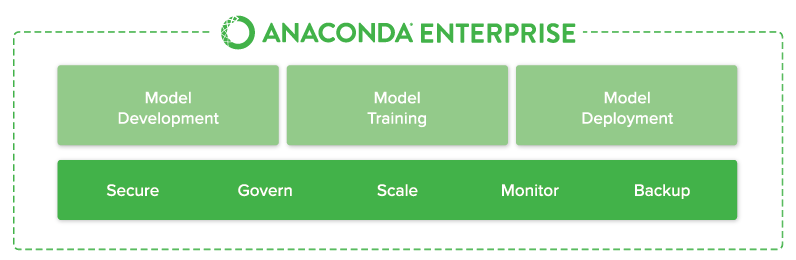
Anoconda
“The World’s Most Popular Python/R Data Science Platform”.
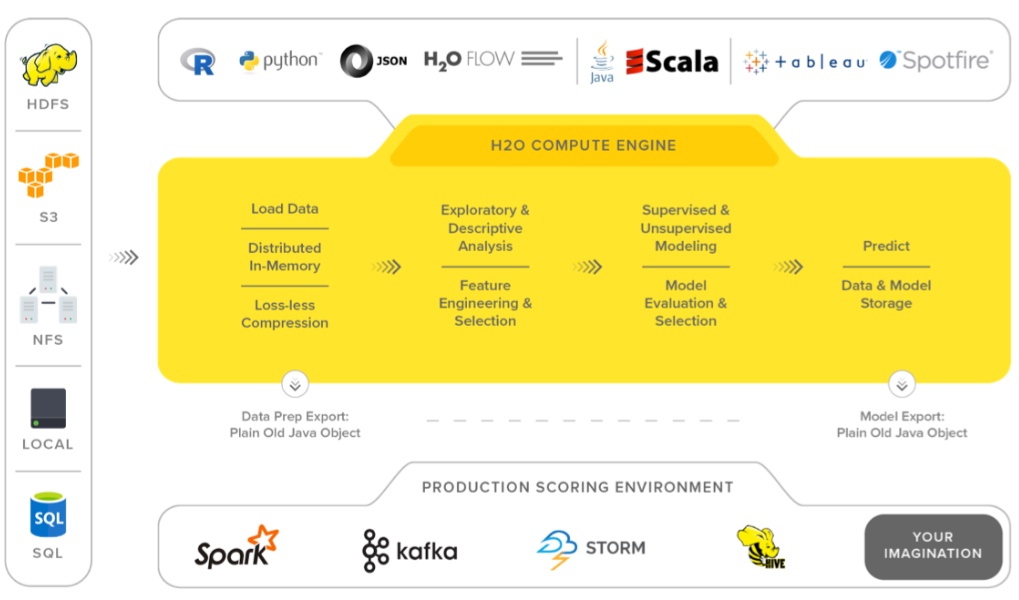
H2O
“A fully open source, distributed in-memory machine learning platform with linear scalability”.
Domino
“Data science platform for model-driven businesses”
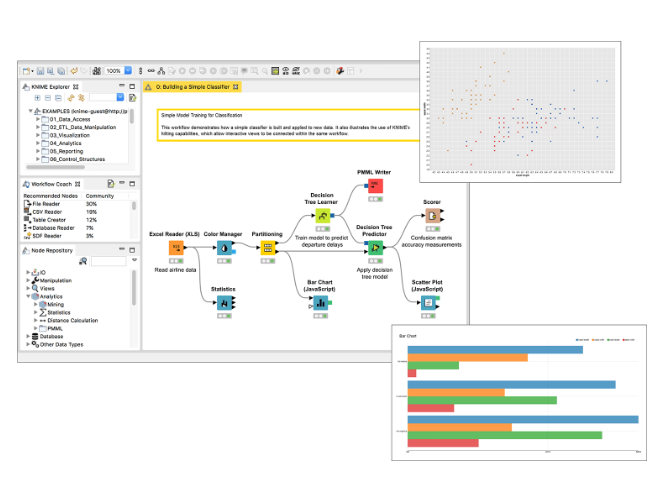
KNIME
“KNIME Analytics Platform, Creating data science”
Dataiku
“The collaborative data science software platform for teams of data scientists, data analysts, and engineers to explore, prototype, build, and deliver their own data products more efficiently”
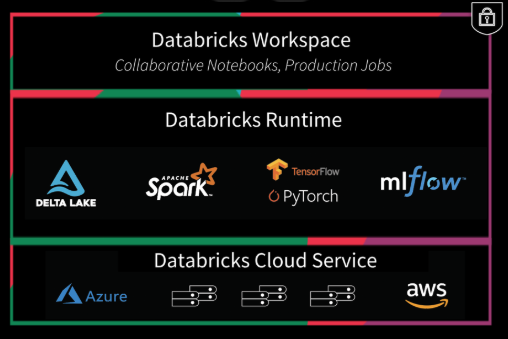
Databricks
“Accelerate innovation by unifying data science, engineering and business, with the Databricks Unified Analytics Platform, from the original creators of Apache Spark”.
Reference:
- A Berkeley View on Serverless Computing is a must read before you’re entitled to talk about serverless.
- Akka creator, Scala guru Jonas Boner proclaimed the stateful serverless vision but didn’t offer much direction.
- MartinFowler.com always has in depth stuff. Here is their take on serverless.
- A discussion on Hacker News on serverless: 15% slower and 8x more expensive
- Gartner Magic Quadrant in Data Science and ML Platform
- Magic Quadrant for Analytics and Business Intelligence Platforms
- Don’t know how much their founders understand analytics, but Domino’s data science platform could really benefit from the reference model.
- Microsoft Azure ML Studio
- Comparing ML-As-A-Service