(Last updated: 09/23/2019 | PERSONAL OPINION)
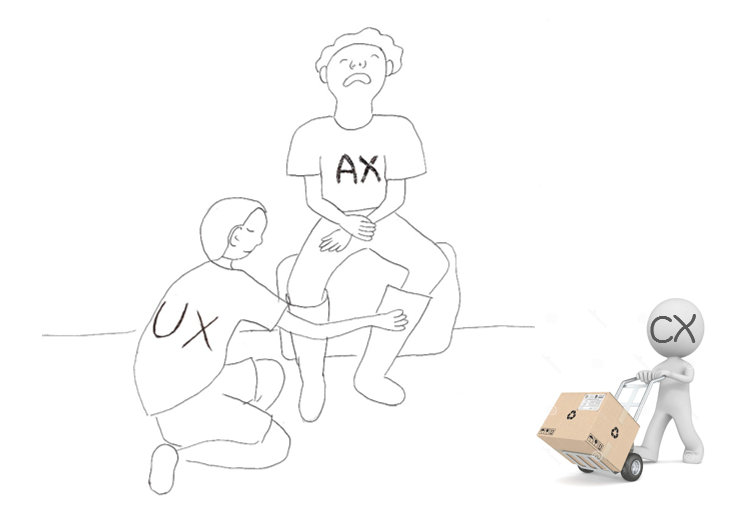
At where I work which is analytics heavy, User Experiences (UX) designers has the final say yet because they don’t have the domain knowledge, they routinely defer design decisions to developers who don’t have any sense of design. That makes me want to explore and investigate Analytical Experience (AX), the specialized UX in the domain of analytics. What exactly is AX? How is it different from UX and Customer Experience (CX)?
Move over UX and CX, AX is the “X” for analytics shops
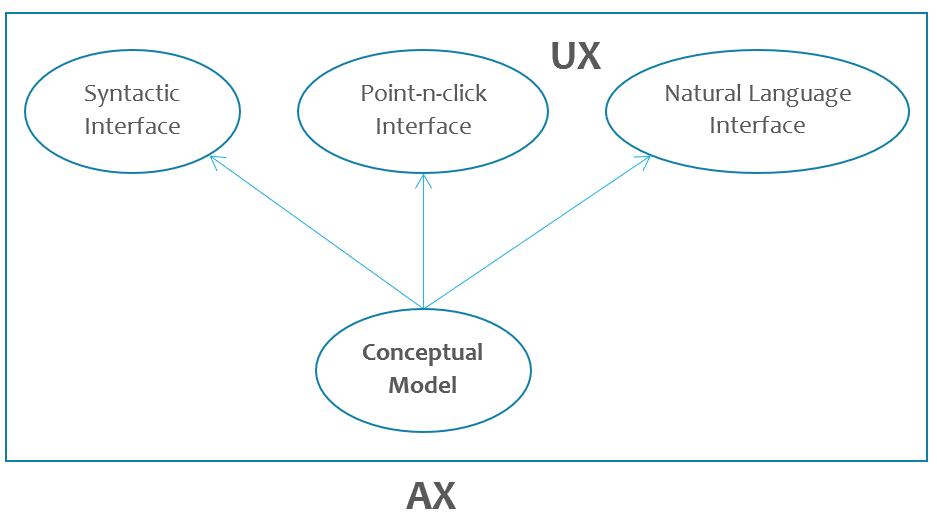
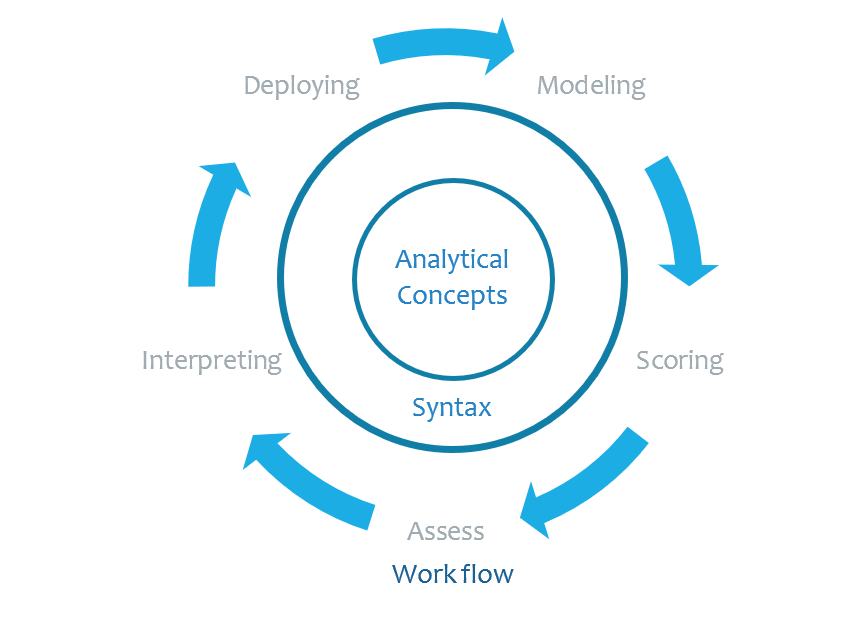
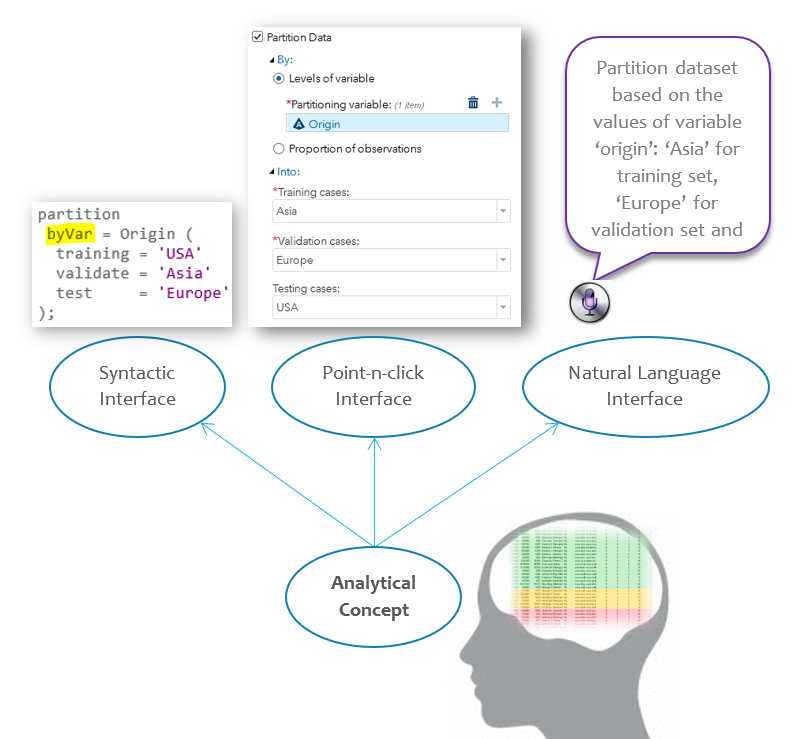
UX to AX is like scratching our users’ analytical itching feet without taking off their boots. To adequately appeal to our analytical users’ needs, we must have Ph.D. level analytical domain experts in the room with the UX designers. While UX focus on the visual point and click interface, AX goes deeper and broader: At its root, AX starts with a conceptual model of the analytical concepts and workflows that “click” with users’ analytical mindset. The same conceptual model is then embodied into different type of interfaces: visual point and click interface, syntactic programming interface, natural language conversational interface, virtual reality interface… The amazing thing is: because all forms of interfaces are rooted from the same conceptual model, the experiences of using them are more or less the same!
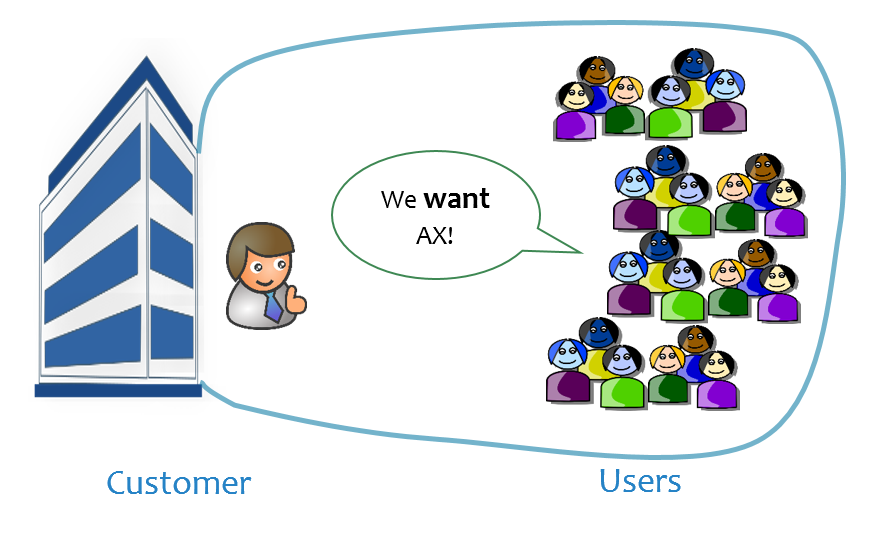
CX focuses on delivery and licensing of software products. The IT operators and economic buyer (for example, a CIO) of a customer most likely don’t understand the lived experience of real users in their organization. What we’re concerned here are the experience of the end users. Our premise is that when end users are delighted, they will let the economic buyer of their organization know that they want the product with great AX.
The tale of many partitions
To empathize with analytical end user’s experience, let’s examine a simple task of partitioning a data set into multiple subsets. While the task is barely analytical, the user’s experience is indicative of that complex analytical models.
The task: partition a data set
In the analytical model development workflow, users normally partition input data set into several subsets for different purpose: the training data is used to develop the model(s), validation data to select the best performing model and test data to estimate the accuracy of the selected model.
Since the partitioning task is so common, it is implemented many times within different products in various forms of interfaces by different vendors. Let’s take a look at a few of them.
Interface 1 for partition
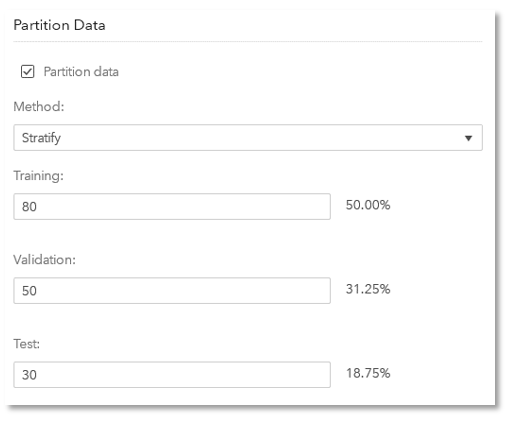
You specify a weight for each of the three partitions and the corresponding percentages are automatically calculated. Note the weights are relative and don’t have to add up to 100.
Interface 2 for partition
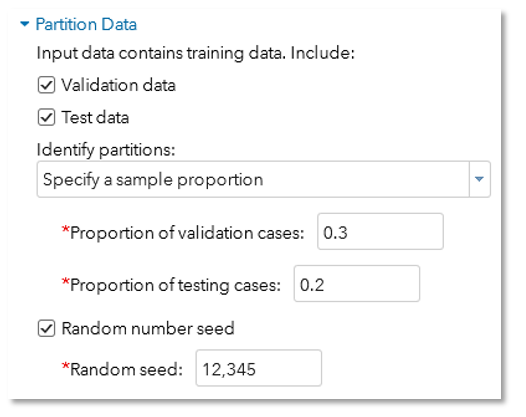
A lot of wording in the interface. The fact that training data is a mandatory partition is easily missed if you don’t pay attention to the sentence “Input data containing training data”.
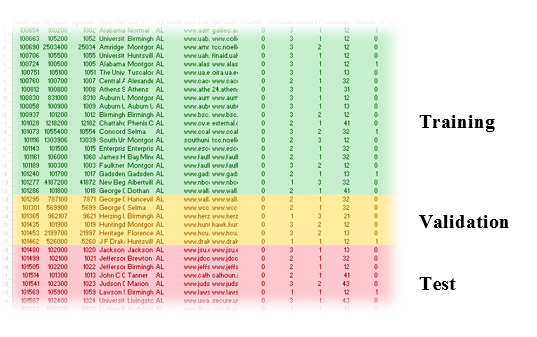
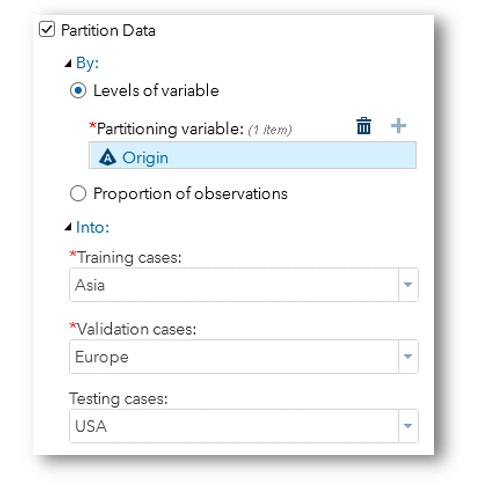
Different partitions can be identified by proportions (which adds up to 1.0) or the values of an identifying variable as shown below:
As I watch the interface shrink and expand while I point and click at different points, I can’t help thinking that I’m navigating through a maze.
Interface 3: Programming
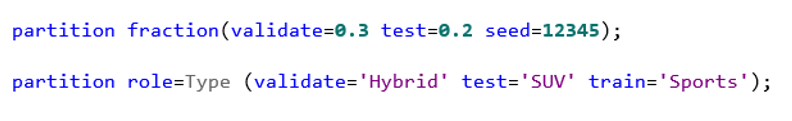
The first line is obviously partitioning by fraction. But can you figure out what the second line is doing? If you were told its partitioning by values of the variable “Type”, you can’t help asking what does the keyword “role” mean?
Partition: the single unified experience
What’s frustrating is, for the same partition task, there are so many implementations that have inconsistent interfaces. From the three implementations we surveyed before, it’s evident that they’re designed and built by different groups of people who don’t talk with each other.
For the task of partitioning data set, there should be only one experience, rooted from the same conceptual model of the process to get the task done.
Structurally there are two dimensions with the partition task itself:
- Partition by what criteria? The values of a variable or proportions of observations?
- Partition into what subsets? Training, Validation, Test or combinations of them?
Behaviorally, there is a mental hurdle for the activity of choosing a value of a variable without knowing all the available choices. A combo box which shows available values for user to pick addresses this pain point.
An interface that aligns with user’s conceptual model of the task brings out the most delightful experience:
By far I deliberately stayed clear of loaded terms such as zero-inflated models, neural networks, and support vector machines. For those complex analytical concepts and tasks, you only find more implementations of more inconsistent interfaces among different analytics vendors.
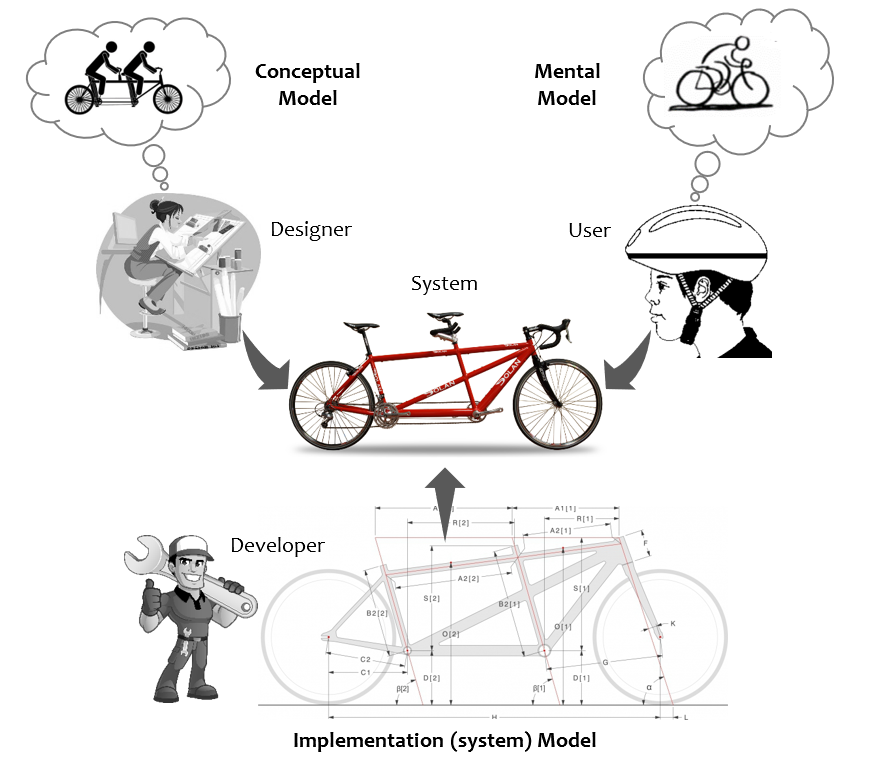
Mental, Conceptual and Implementation (System) Models
Psychologist Susan Carey defines mental model as “A mental model represents a person’s thought process for how something works (i.e., a person’s understanding of the surrounding world). Mental models are based on incomplete facts, past experiences, and even intuitive perceptions. They help shape actions and behavior, influence what people pay attention to in complicated situations, and define how people approach and solve problems.”. Jay Wright Forrester, the father of system dynamics, described a mental model as: “The image of the world around us, which we carry in our head, is just a model… He has only selected concepts, and relationships between them, and uses those to represent the real system.”
A conceptual model is the visible structures of the system which indicate how it works. Affordance, constraints and mappings are all examples of elements of a conceptual model. In software context, think interface, think API for conceptual model.
An implementation (system) model is the invisible part of the system which does the work. In software context, think design specification, think algorithm.
Then there is the actual system, which is the actual thing delivered to the user. Ideally you want all three models agree with each other for a pleasurable user experience. When designers’ conceptual model and user’s mental model don’t agree, you got design defects. When developer’s system model doesn’t agree with the actual system built, you got development defects.
Analytical Mindset
Mindset shapes user’s mental model. “A consistent pattern of thoughts about a specific topic can become a mindset, which represents an established set of beliefs that shape how people think and reason about this topic.” (Auster-Gussman & Rothman, 2018)
Analytics users are different. Compared with general users such as those of Google news website or Microsoft office products, analytical users have a unique mindset which calls for special consideration: They have sophisticated analytical concepts on their minds. They have peculiar ways of dealing with analytical artifacts in their domain. They often switch among multiple modes of interfaces (point-n-click, programming, visualizing) to get things done. To elicit delightful experience from our user, we must cater to the analytical aspect of their mindset.
Analytical Experience (AX)
Delightful analytical experience starts with good conceptual model of the analytical artifacts and processes. It requires deep understanding of users’ mental images of the analytical concepts and the process they carry out analytical work flows.
User interface’s job is then to simply actuate the conceptual model and make it visible and easy to use: bringing forward the underlying structure, automating the look up, preventing errors from happening…
Rooted from the same conceptual model, different forms of interface of the same analytical task can and should generate the same delightful user experience! When user partitions a data set, whether via point-and-click, programming, speaking or telepathy interface, she is experiencing the same “partition by what, partition into what” thought process in her mind.
Since each interface form has its pros and cons, multiple forms of interface must be provided to accommodate different application needs, user levels of expertise and taste.
Analytical Components (AC)
When the same pattern of analytical activities occurs in various products, it makes sense to componentize the pattern into a single piece which enables reuse across applications. Analytical components consist of three elements:
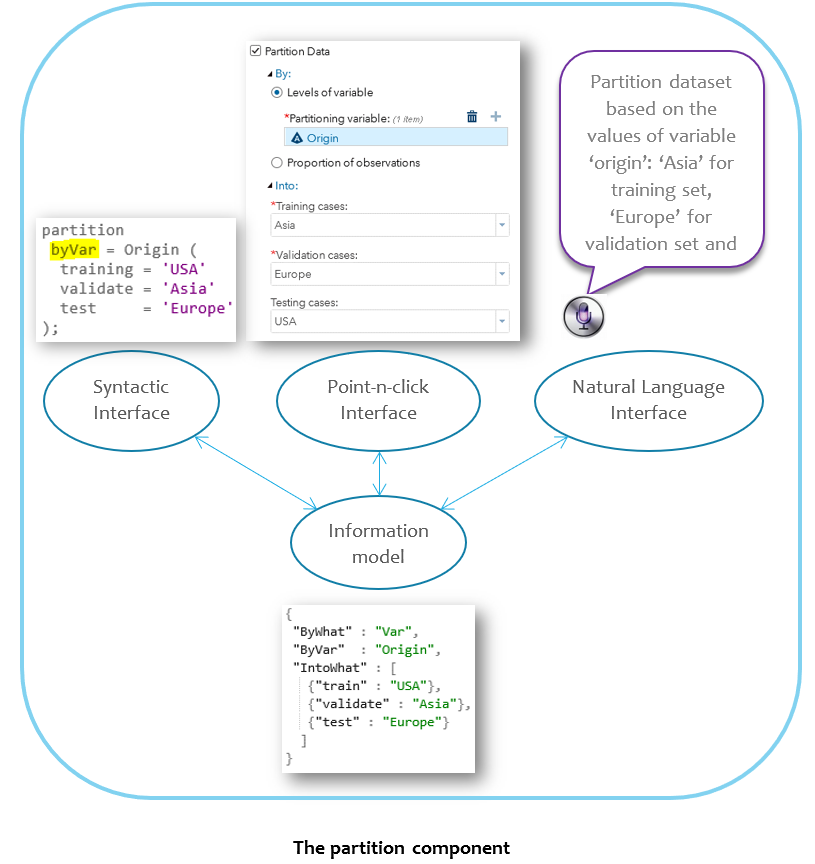
- Interface: Look + feel + syntax + behavior. This defines the conceptual model and user experience of the component.
- Information model: Data which captures the state of an interface instance. Additionally an ontology which captures the meaning of each data points. Different forms of interfaces of the same component share the same information model. Serialization and deserialization to the same information model enables transformation among different forms of interface.
- Implementation. The technology stack used to implement the look, feel, syntax, behavior and information model of an analytical component.
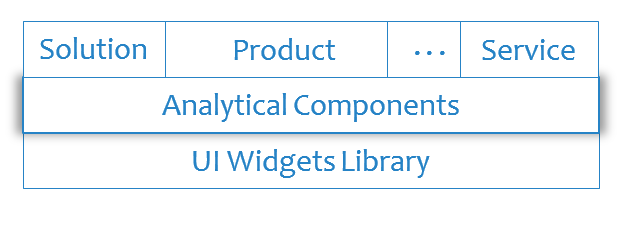
Based on UI Widgets Library
Analytical components are ideally built on top of UI widget libraries and are reused by multiple applications. If the UI widgets are general purpose nuts and bolts, analytical components are purpose built assemblies such as fans or motors.
Retainer of institutional analytical know how
Flash, UI 5, Angular, React… Implementation technologies come and go. But institutional analytical knowhow stays the same. Interface and information model of analytical components captures an vendor’s institutional analytical knowhow.
In summary, the centrally crafted and maintained library of analytical web components captures a vendor’s understanding of analytics, differentiates its offering from competitor’s, ensures uniform user experiences across different product lines, prevents reinventing of the wheels and boosts development productivity.
References
- Nice discussion on Mental model vs Conceptual model. Especially insightful comment:
“I often use modelling techniques to think about/model
- Tasks and activities (verbs, like described in Indi Young’s book)
- Objects and things (nouns, like described in the object modeling and user interface book.)
- Systems (relationships and flows)
Each task then becomes a potential candidate for a button or link, and each object could be a row in a table, a graphic etc – the systemic model captures what belongs together on one screen or in one workflow.”
Appendix: AX Case Studies
The most critical ingredient to a pleasant analytical experience is the perfect match between the conceptual model exemplified by software’s interface and user’s mental model. Yet, we violate this principle in our shipped software through and through. Below are a list of AX bloopers I encountered while working at SAS Institute. As a fourth-gen language designed for statisticians and data analysts, SAS the language is known for being intuitive and easy of use. Yet still many of the syntaxes are a lot more than desired to say the least.
Wrong Conceptual Model
Let’s take the frequently used CASUTIL procedure as an example and per its official documentation:
The procedure (CASUTIL) has three functional areas:
- data transfer
- table and file information
- drops tables and deletes files
For functionality of “data transfer”, the most natural mental model most users come up looks like below:
![]()
What’s the conceptual model behind the software interface? In, out, transform.
![]()
What do we do with the gap between the conceptual model (transform) and the mental model (transfer)? Fix the syntactic interface of the CASUTIL procedure! As an alternative, in the point-n-click interface, we can present the right conceptual model to the user while hiding the wrong one in the generated code.
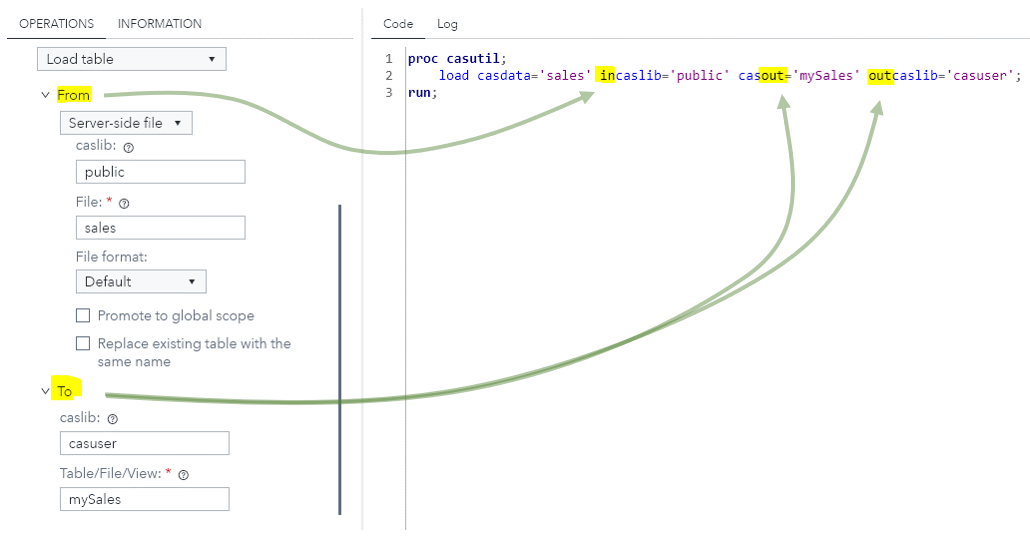
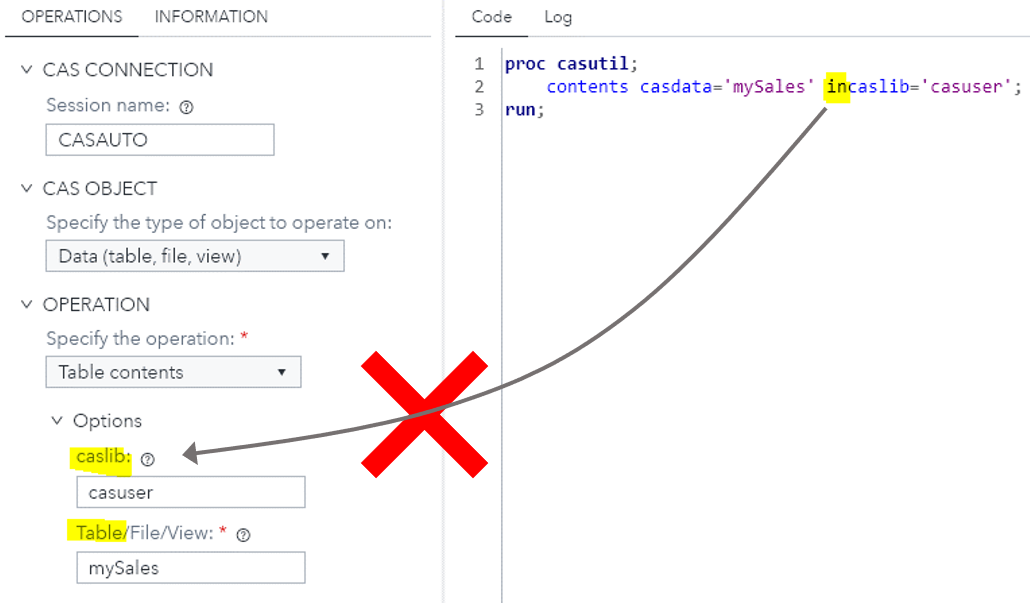
When user wants to list the contents of a CAS table with CASUTIL procedure, which has nothing to transfer and transform, the software interface is still infested with the wrong “In, Out” conceptual model. With all the confusions added to user’s mind, saving a few definitions in the grammar file is not worth it.
Conceptual Model Encroaching on Mental Model
When users have a well-defined mental model of something, the conceptual model behind the software interface better not add, change or contradict elements in user’s mental model.
Let’s play the “Dress Marsha” board game with a programmer’s twist: Instead of maneuvering the actual blocks directly, we program a script which executed by a third-party component (such as a robot) to place the blocks accordingly.
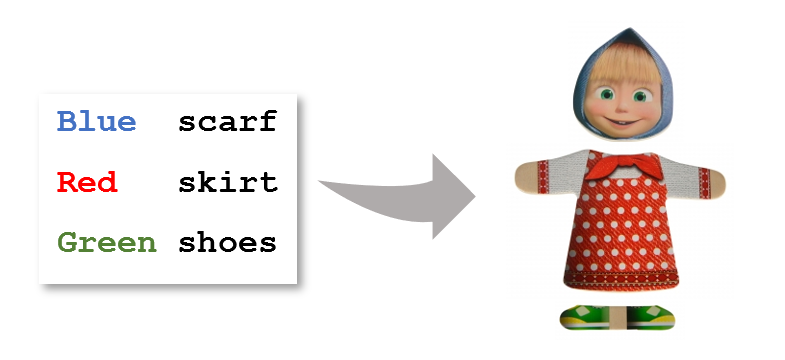
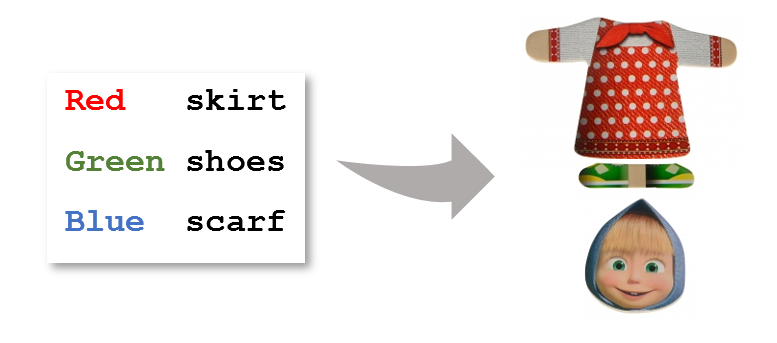
How do you feel if you watch Marsha mutilated as you simply tweak the order of the scripts without changing the colors of each body parts? Bugs! You’ll say.
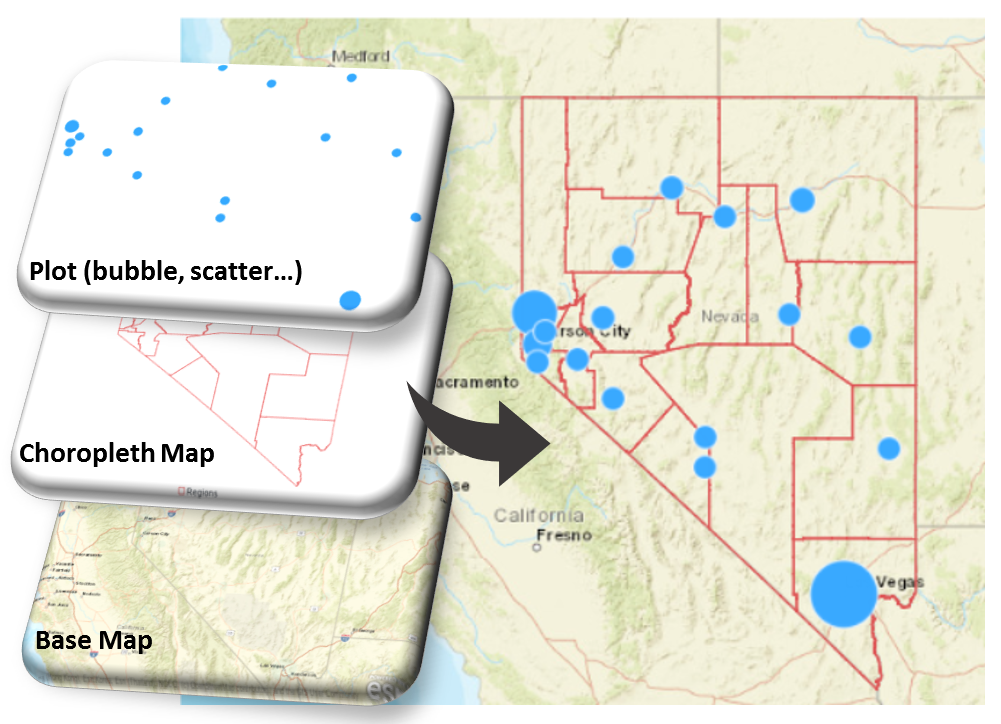
Well, that’s pretty much how SAS’s SGMAP procedure behaves. To wit, below is user’s three-layered mental model of how a map plot works: at the base is the actual map, in the middle a choropleth map which shows geographical boundaries and on the top whatever plot you may want to visualize the relationship between your measures and the geographical features.
And below SGMAP code works as expected:
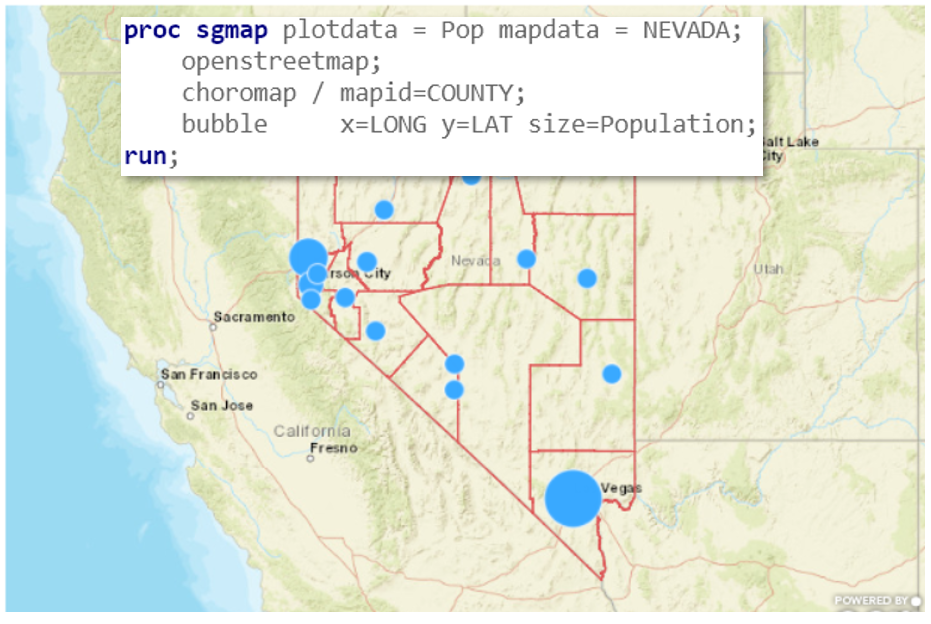
If you simply switch the order of the “openstreetmap;” and “choromap” statements, you got below map plot. Where is my base map? I told you to use OpenStreetMap!
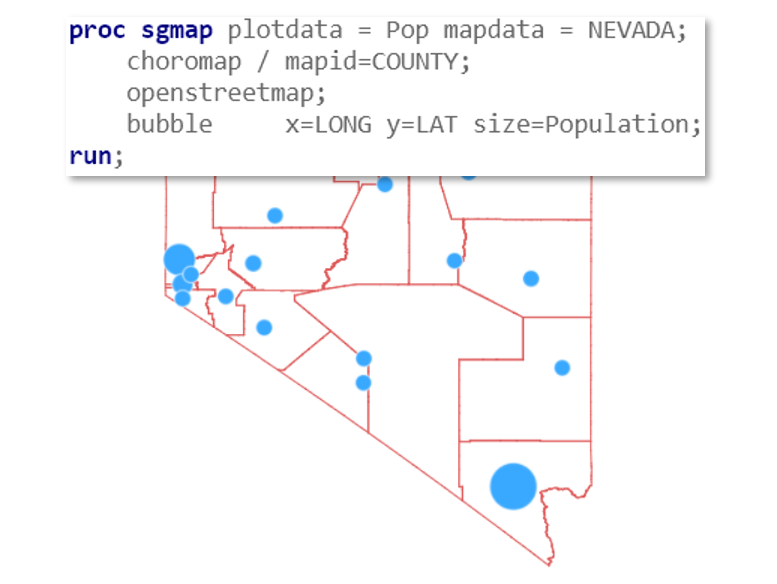
Whatever conceptual model (if there is one) behind the SGMAP procedure interface, it’s fundamentally at odds with the three-layered map plot mental model. In the conceptual model, there seems to be some order constraints imposed on the layers, i.e., base map must be the first map statement in the proc. Plot statement is free to roam around.
Here we have a case where the order among the three layers are clearly defined in the mental model: base map the bottom, choropleth in the middle and plot on the top, yet the conceptual model behind the procedure syntax imposed a constraint: base map must appear first.
The right system model for SGMAP procedure should be declarative. Users declare base map, choropleth map and the plot in however order they like. SGMAP procedure assembles them together according to the order in the mental model: base map at the bottom, choropleth in the middle and plot on the top.
Implementation Model Creeping into Conceptual Model
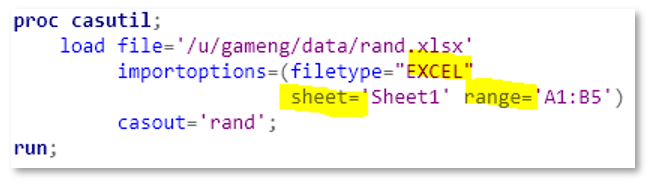
Implementation details must not show up in the user interface. To load a range of cells in an Excel sheet into CAS, the conceptual model is simple: Which sheet? What range? And the “sheet=, range=” parameter pair conveys perfectly the two-dimensional structure of the conceptual model:
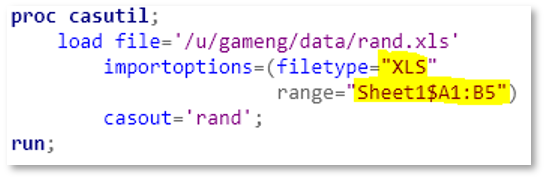
But, when the spread sheet is of an older version (.xls), the interface changes. You must mingle the sheet name and range together separated by a dollar sign. When there are special characters in my sheet name, I don’t know how to mingle the sh*t right (oops, I meant “sheet”).
And in our usual fashion, we document user’s pain away knowing nobody reads it:
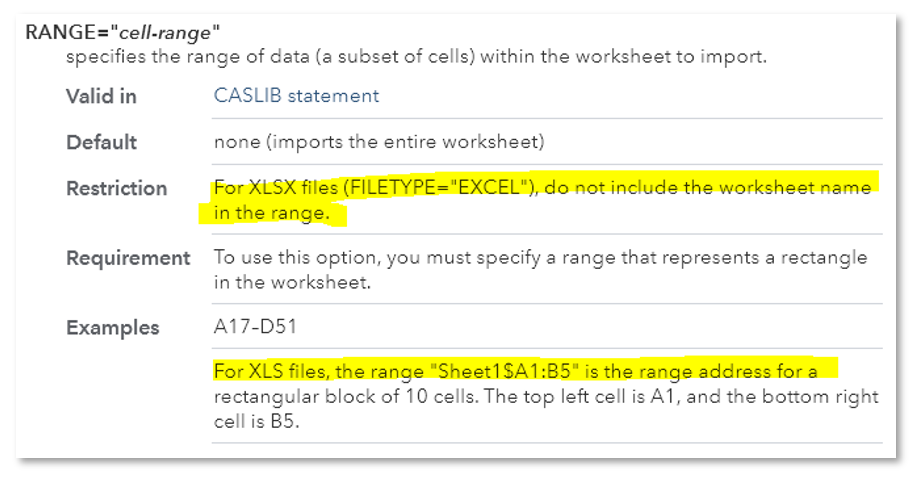
But, why different interfaces for the same thing? My spread sheet might be of an older version, there are still the same concept of a sheet and a range in that sheet! That’s the way how the underlying Microsoft Office API is written… Well, Microsoft was wrong, and they corrected the API for newer version of the file (.xlsx). To our user the Microsoft API is implementation details which should not be exposed through the interface. Users only need to tell us the sheet name and the range, we should mingle them together, behind the scene! Our syntactic interface doesn’t do it right, but we can still right the wrong at the point-n-click interface:
Confusing Labels for Conceptual Model
Interface labels should reflect the conceptual model as close as possible.
Choose Verbosity for Clarity
What do you think an “Apple Pear” is? An apple, a pear, or the offspring of apple and pear? What do you think an “Apple Textured Pear” is? A pear, no doubt about it.
What do you think a “CAS engine libref” is? A caslib, a SAS libref, an engine? What do you think an “SAS libref for caslib” is? It’s a SAS libref the foremost, and it points to in-memory tables in a caslib.
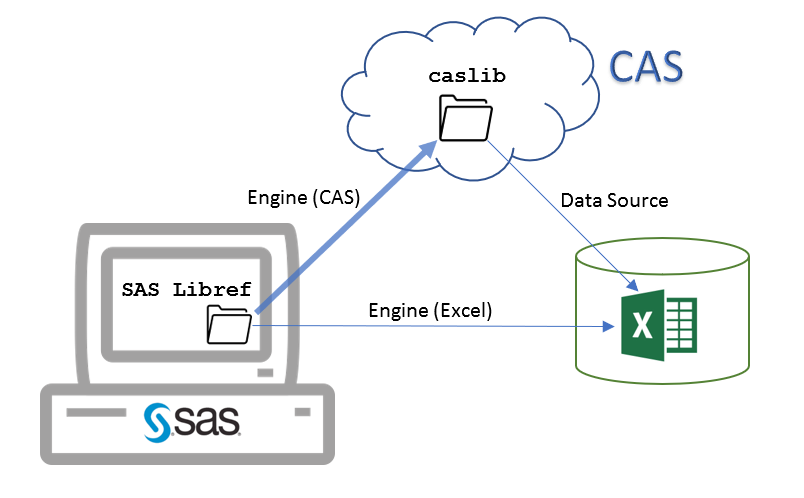
SAS libref has engines and CAS libref has data sources, so the only correct interpretation of the “libref” in “CAS engine libref” is a SAS libref. But expect everyday users to understand and go along this line of reasoning is lunatic. As any normal people do, they just think “CAS engine libref” as a “CAS libref” and then a “CAS lib” and finally a “caslib”. With just one more word, “SAS libref for caslib” hides the confusing “engine” piece and conveys what the libref truly is.
Inconsistencies and Exceptions in Conceptual Models
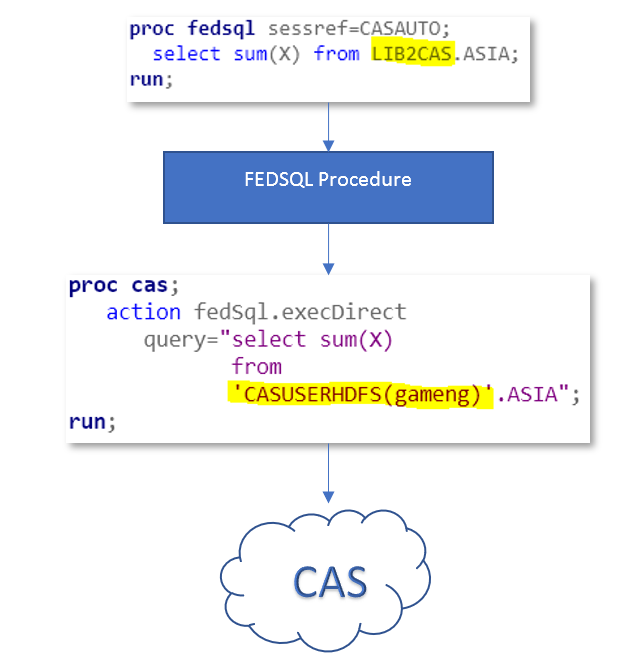
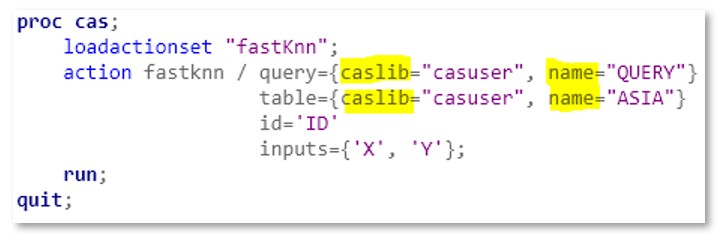
All SAS procedures reference data sets in the form of two-level names: libref.data, with two exceptions: the CAS procedure and the FEDSQL procedure.
I’ll give the CAS procedure a pass since the name of the procedure indicates one is operating within the CAS world. And the explicit use of “caslib=” and “name=” pushes the syntax outside of the uncanny valley with that of the two level names:
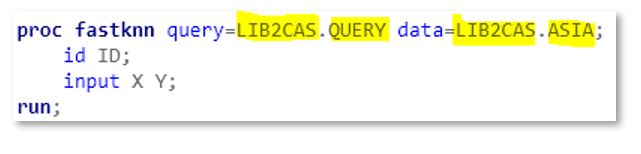
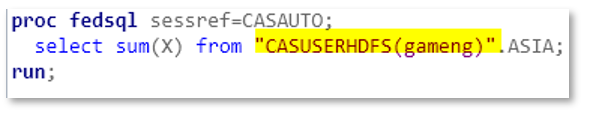
Not the case for the FEDSQL procedure, where you must use caslibs as the first level of your data (not to mention the case sensitivity and quoting rules):
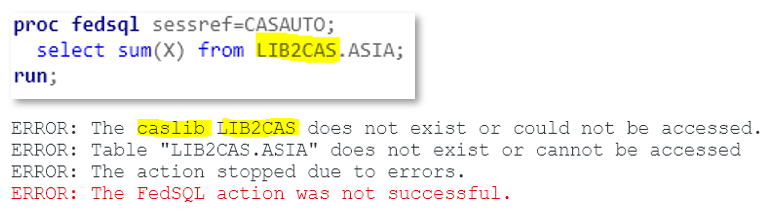
Try the usual two-level name and you’re met with ERROR’s, which clearly states it’s expecting a caslib, not SAS libref.
But lord, how could everyday user find out the caslib associated with a SAS libref?
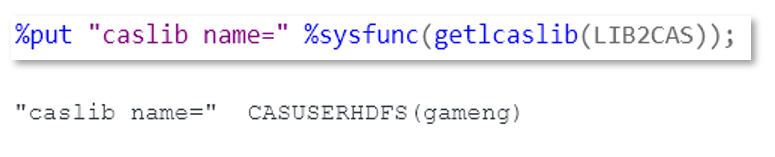
The correct behavior of FEDSQL procedure? Let users use SAS libref in the proc code and translate it to caslib before submitting to CAS for execution.