(Last updated: 09/27/2022 | PERSONAL OPINION)
When I worked as an intern in GE R&D center more than two decades ago, my boss was a Paris 6 (Pierre and Marie Curie University) trained mathematician specialized in infinite-dimensional partial differential equations. If you’re not wowed yet, a year prior, he single-handedly figured out a theory to tract the motions of an axisymmetric and inviscid swirling flow of a vortex breakdown in a pipe. At the time, GE hired him to develop the perfect curve for, ahem… ahem…, the fan blades in the GE refrigerators you would find in a typical kitchen. The goal? To maximize the air volume pushed around by the fan while minimizing the noise as much as possible.
So, he got this five-feet long Matlab program that has two dozen parameters sprinkled around. Whenever he wanted to tweak a few parameters and see what’s the resulting curve is, he would open the program, painstakingly locate where the parameters are in the program, do the mod, and save the resulting picture for later comparison with pictures of different configurations. I volunteered to develop an UI (see screen capture below for a rough idea) where he can turn the knobs and immediately see the resulting curve.
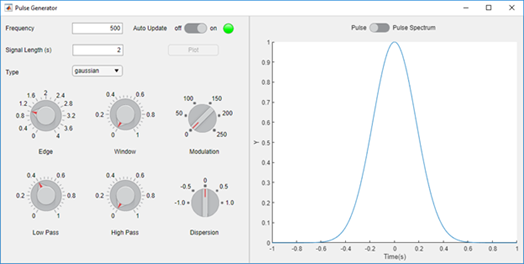
This time, it was him who was wowed by my work. He took me out and treated me a Big Mac lunch[1] at McDonald! I said “You don’t really have to do this. It didn’t even take me an hour”. He looked at me right in the eye, with dead serious voice and said: “Young man, you don’t understand the importance of putting an UI on top of a piece of code. It’s not code anymore. It gets its own life! I can now use it to demo to higher executives. I can give it to the technicians in the workshop downstairs, so they can turn the knobs until the resulting curve matches those of the fans in the quieter[2] refrigerators”.
Several analytic vendors understand the importance of putting UI on top of a piece of code: Matlab offered the pioneering GUIDE which I used to develop the fan blade simulation UI. R offers Shiny, Python has Dash, Streamlit recently sold itself for $800M… And what they all call the “UI + Code” thing? Analytics Apps. Apparently paying homage to Steve Job’s app store. But to me, their potential lies in turning any piece of code into an app quickly and easily.
Anatomy of an Code Appification Framework
Code Appification Framework’s value proposition lies at democratizing UI development, so data scientist, theoretical physicists, mechanical engineers… all coders alike can easily put UI on top of their code and share it with other stake holders. The key word is “easy” here. The further the Code Appification Framework stays away from imperative programming, the better.
Let’s look at Matlab’s GUIDE, to illustrate what an Code Appification Framework entail.
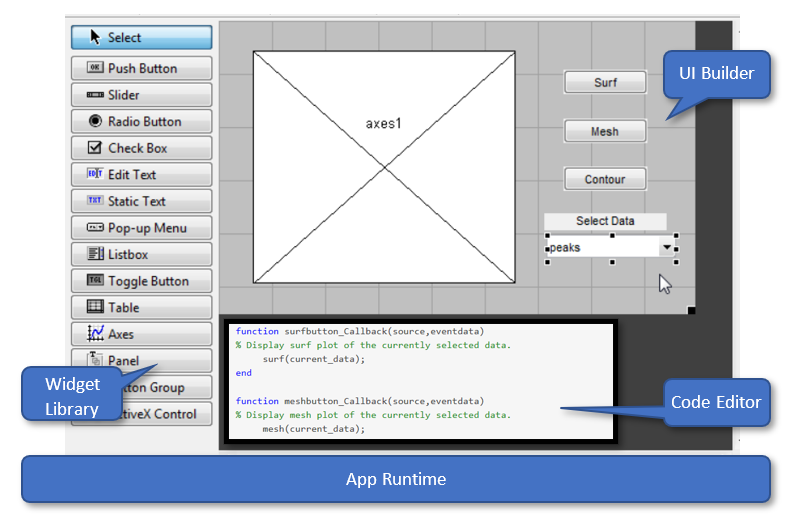
Widget Library
Widget are the “knobs” app developers placed in the UI. I’d like to emphasize on the differences between what I call the dumb and the smart UI widgets.
Dumb Widget
The options (information model) of the dumb widget is defined at app development time:
    eventOfInterest.Dropdown(
        options=[
            {'label': 'Asia',   'value': 'ASIA'},
            {'label': 'Europe', 'value': 'EU'},
            {'label': 'USA',    'value': 'US'}
        ],
        value='EU'
    )
Once defined by app developer, the drop down knows only the predefined values. Dumb widgets are static. Data changed? The App needs to be rewired.
Smart Widget
Smart widget retrieves and populates its options with data set’s meta-data, at app’s runtime:
<widget name      = ”Event of interest”
        type      = ”Dropdown”
        sourceVar = ”$Response”/>
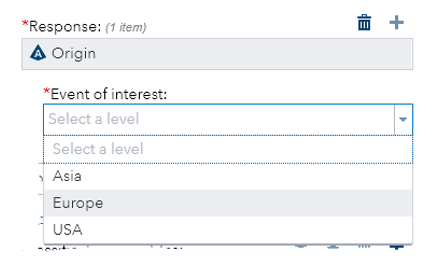
The smart drop down retrieves the distinct values of the variable “Origin” and display them for the user to choose from. Smart widgets are dynamic. Data set changed? Widget updates their options automatically, no need to change the app.
UI Builder
UI can be “drawn” with a visual drag-n-drop UI builder or laid out in a textual format. We all know which option is the best for the user, yet when it comes to programmatic definition of the UI layout, there are two different styles.
Imperative UI layout
Look at below Dash UI layout which contains a title, subtitle and a graph. It’s 100% Python code with each widget having a corresponding Python class. The widget classes are named in a way that resembles React JSX syntax. Imperative UI layout is hard core programming, which is fundamentally against analytic app’s “easy” principle.
app.layout = html.Div(children=[
    html.H1(children='Hello Dash'),
    html.Div(children='''Dash: A web application framework for Python.'''),
    dcc.Graph(
        id='example-graph',
        figure={
        ...
        }
    )
])
Declarative UI layout
With high level widgets objects and attributes which are not mired in any programming syntax, declarative UI layout is as simple and intuitive as it can be.
<App>
  <Title label="Hello Dash"/>
  <Subtitle label="Dash: A web application framework for Python"/>
  <Graph name="example-graph" figure={...}/>
</App>
Code Editor
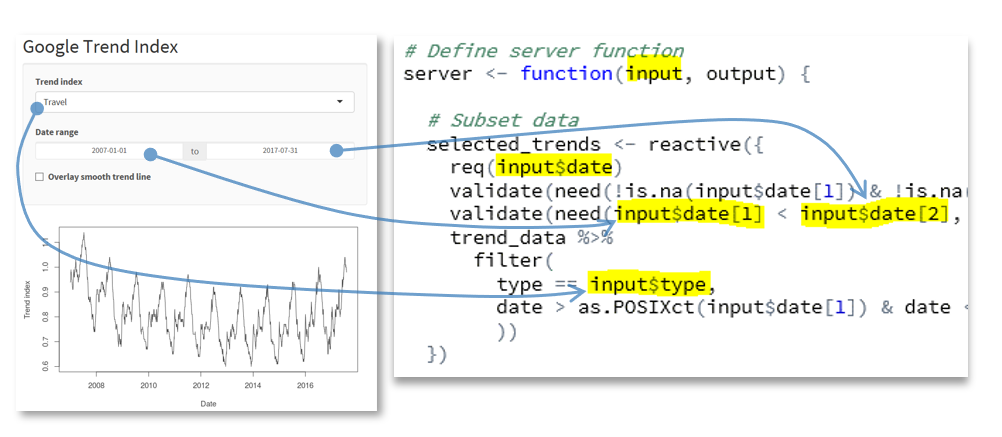
How do you link the UI and code together? App runtime comes to the rescue! For example, R Shiny app runtime packs values of all input widgets in the “input” data frame which you may use in your code.
Code Generator
Another way to look at the “UI” vs “Code” juxtaposition is UI being the problem specification mechanism based on domain conceptual model and code being the syntactic solution/implementation of the specified problem. End users formulate their problem with the UI and they couldn’t care less about the code which is just implementation details.
For expediency and self-promotion, all analytics app frameworks limit code to one and only one language: GUIDE -> Matlab; Shiny -> R; Dash -> Python; SAS/Tasks -> SAS… For a given specification of the UI, in many cases it’s desirable to use the most efficient language for the code for performance reasons or let user pick the language for educational purpose. Code Appification Framework can and should be polyglot.
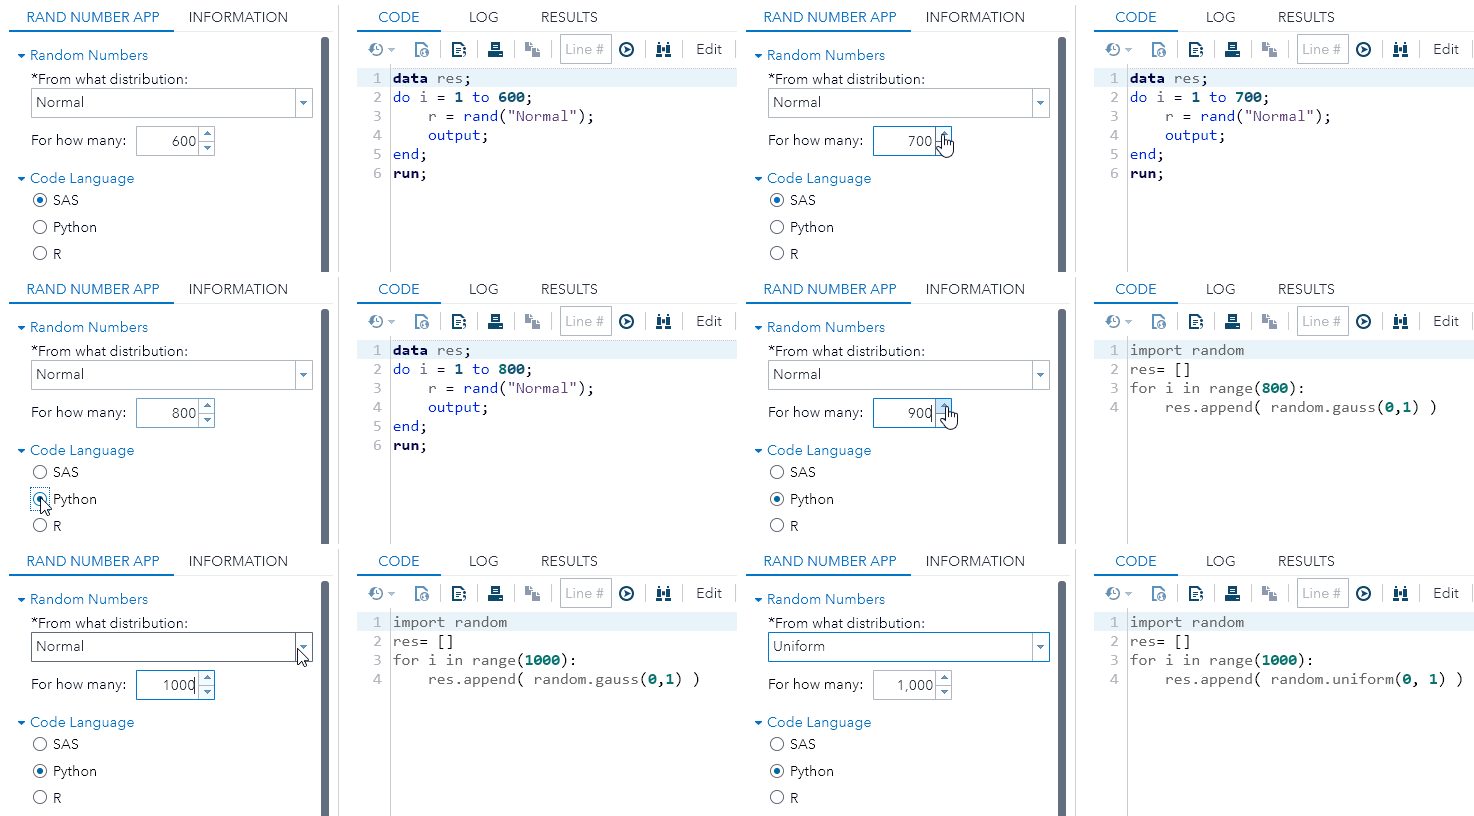
Code template is one way of achieving polyglot in Code Appification Framework. Within the code template, app developer uses the template language to control what code to generate based on UI widget’s values. Since code template is code that generates code, we call the technique meta-programming.

Many template engines exist, such as Apache Velocity for Java, Jinja2 for Python, Jinja-JS for JavaScript and Pongo2 for go. All of them are self-explainable enough that any programmer can pick them up in no time. As an example, the Apache Velocity code template for the Random Number Generator app is shown blow (Green are template language):
#if ($lang == 'SAS')
data res;
do i = 1 to $N;
  #if($distribution == "normal")
  r = rand("Normal");
  #elseif( $distribution == "uniform")
  r = rand("Uniform");
  #end
  output;
end;
run;
#elseif ($lang == 'Python')
import random
res= []
for i in range($N):
  #if($distribution == "normal")
  res.append( random.gauss(0,1) )
  #elseif( $distribution == "uniform")
  res.append( random.uniform(0, 1) )
  #end
#elseif ($lang == 'R')
... R implementation goes here
#end
App Runtime
Specification and execution are the two main stages of interacting with an app. There are two styles of app execution:
- Reactive. Any UI widget change event will trigger the execution of the app code and refresh of the results. User immediately see the results change as they change the UI.
- Batch. User keeps tweaking the UI widgets until the specification of their problem is complete. At which point, user click a “Run” button to trigger the execution of the code. Batch mode prevents superfluous app execution while sacrificing the immediate feedback the reactive mode offers.
The Competitive Landscape of Code Appification Frameworks
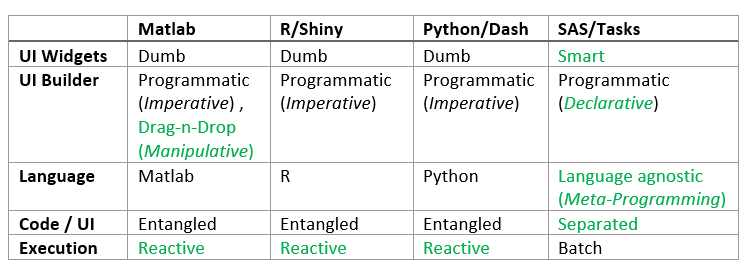
Having seen the anatomy of an analytics app and the variations of each components, we’re now ready to compare different Code Appification Frameworks out there (Green is better):
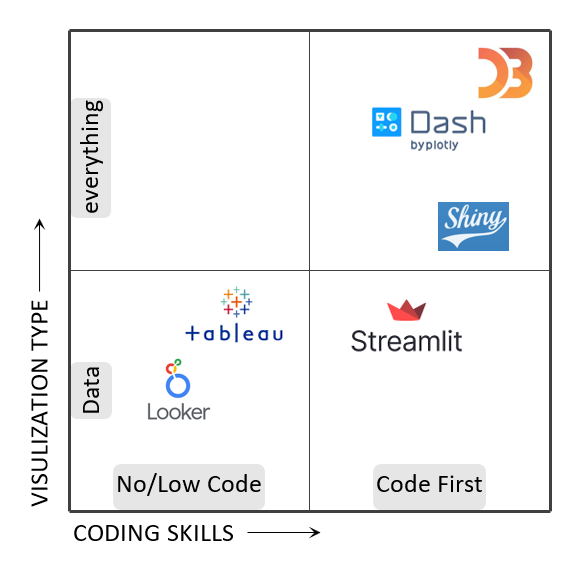
If we bring dashboarding tools such as Tableau into the mix, you’ll see they sit at the opposite ends of the spectrum:
- Productivity vs flexibility. Tableau provides off-the-shelf but limited types of visualizations. Rapid appification framework provides ultimate flexibility to satisfy your most peculiar needs.
- No/low code vs code first. Tableau apps require little coding to build while rapid appification framework apps is centered around coding. Regardless of their roles(analysts, data scientists, developers), anybody who can code may reap the flexibility provided by rapid appification frameworks. While polyglot is ideal, all commercially available rapid appification framework supports only one language.
- Data vs everything apps. Tableau and Streamlit apps are designed to provide explorability and interactivity around data, while general purpose application framework works with everything: data, algorithm, policy… anything that can be codified can be visualized and interacted with.
A Categorization Scheme for Apps
You got a need for some sort of computation? “Apparently there’s an app for that!”. Soon, when explosive number of apps emerges, we need to classify and categorize them.
Point, Flow, Spread Sheet and Conversational Apps
From the angle of how an app is structured, there is point apps, which can be thought of as single function rectangular box with a set of inputs and outputs. Then there are set of related point apps stringed together to form a higher-level app, implementing certain business logic: If you connect the outputs and inputs of different point apps, you got a flow based app; If you structure your app’s UI like an spread sheet in which the functionality a point app can be embedded like an Excel formula, something like D6 = MyFcstApp(A6,B6,C6), you got a spread sheet style app; If you orchestrate various point apps in an NLP based conversational interface, you got conversational apps.
People asked what’s the difference between data flow and process flow (flow chart). The way I think of it is asking yourself what’s that flowing through the edges: is it “data” which is for data flow or “control” which is for process flow? Of course, you can think of control as a special kind of data, as TensorFlow data flow graph does.
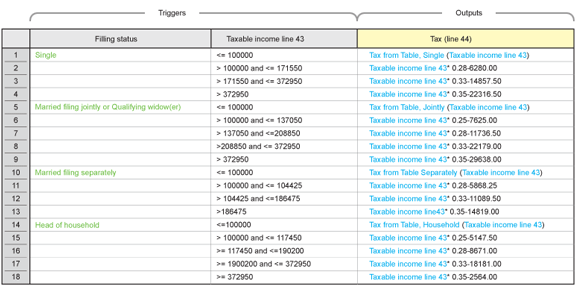
For business processes with complex logic, flow-based app can easily grow unwieldy. Spread sheet style app comes to the rescue for those complex but well-structured logic. See below for an example how Ab Initio’s Business Rules Environment models decision, validation and source-to-target mapping rules as spread sheets:
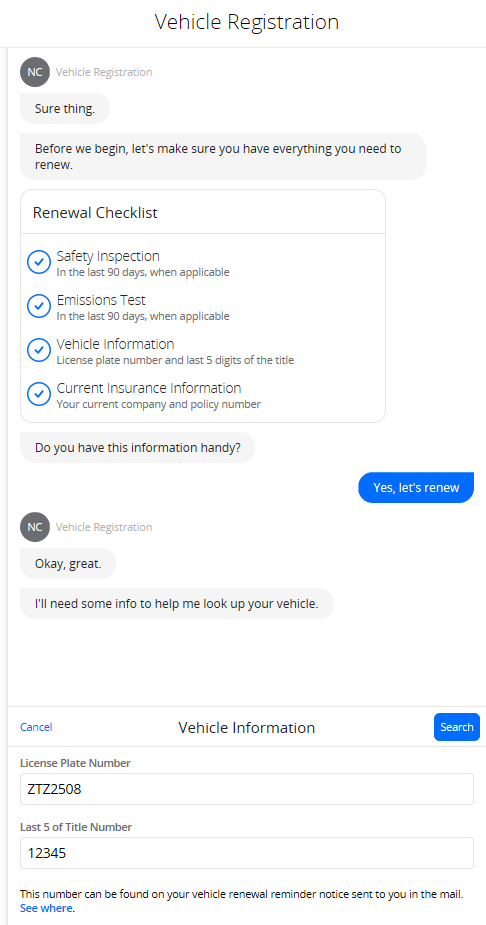
For an example of conversational apps, looks no further than NC DMV’s recent launched Vehicle Registration app, a chatty agent completes with informational guide, search and payment processing capability, each of which is a point app on their own:
General and Domain Specific App Framework
Just like programming languages, some app frameworks are general purpose while others are designed for a specific domain.
Putting Things Together
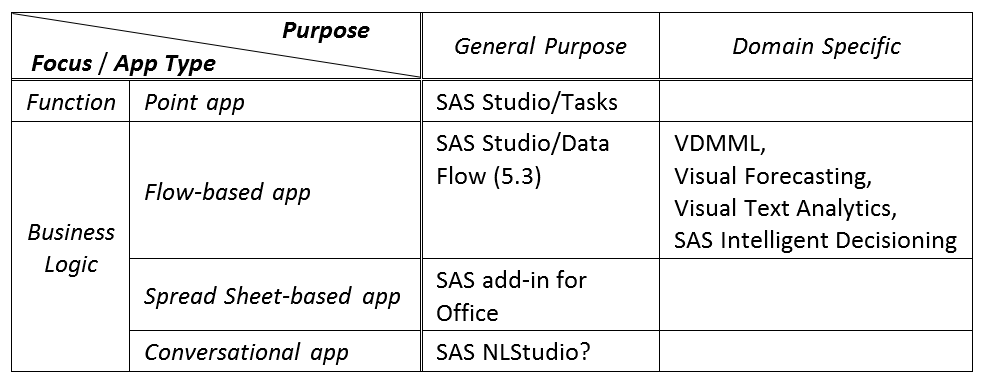
With these two dimensions in mind, various analytics apps of SAS can be categorized as such:
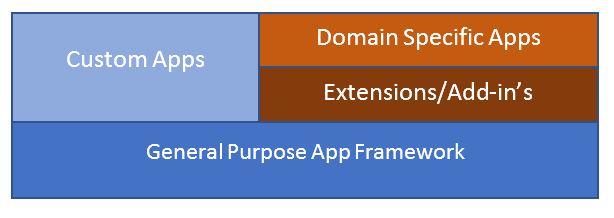
From engineering point of view, domain specific apps could and should be built upon the general-purpose app framework.
This unified perspective and architecture serve the ever-changing market well. Considering entering into the Experience Management market dominated by SAP/Qualtrics? No problem, it’s just yet another type of domain specific app. With a few domain specific UI widgets and a little tweak of the UI flow engine, we’re ready to win!
The generic polyglot appifier for any code? or whatever you name it
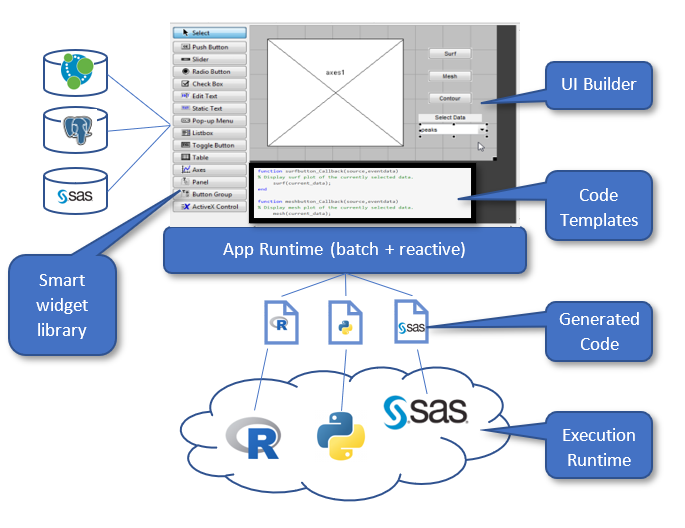
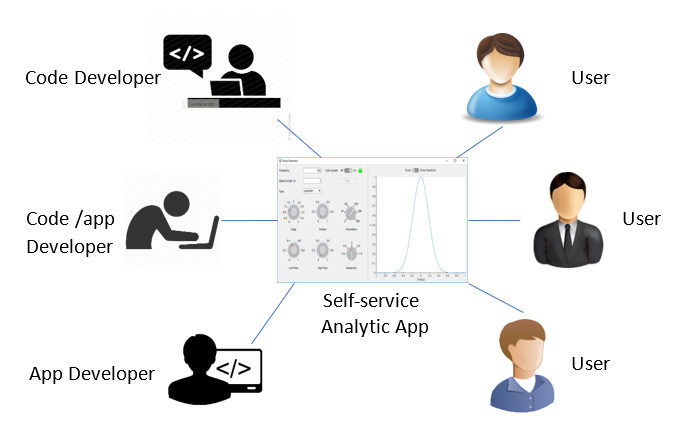
Enterprise customers want to democratize the development of apps, without hiring HTML,CSS and JavaScript specialists. And they’re more than happy to pay money for it. Combining the strength of various players in the field, I imagine an easy, smart and polyglot web Code Appification Framework with below features:
- Smart UI widgets that connect to and understand various data
- Drag-n-drop UI builder
- Template based code generator
- App runtime which supports batch and reactive execution
- Serverless execution engine for various languages
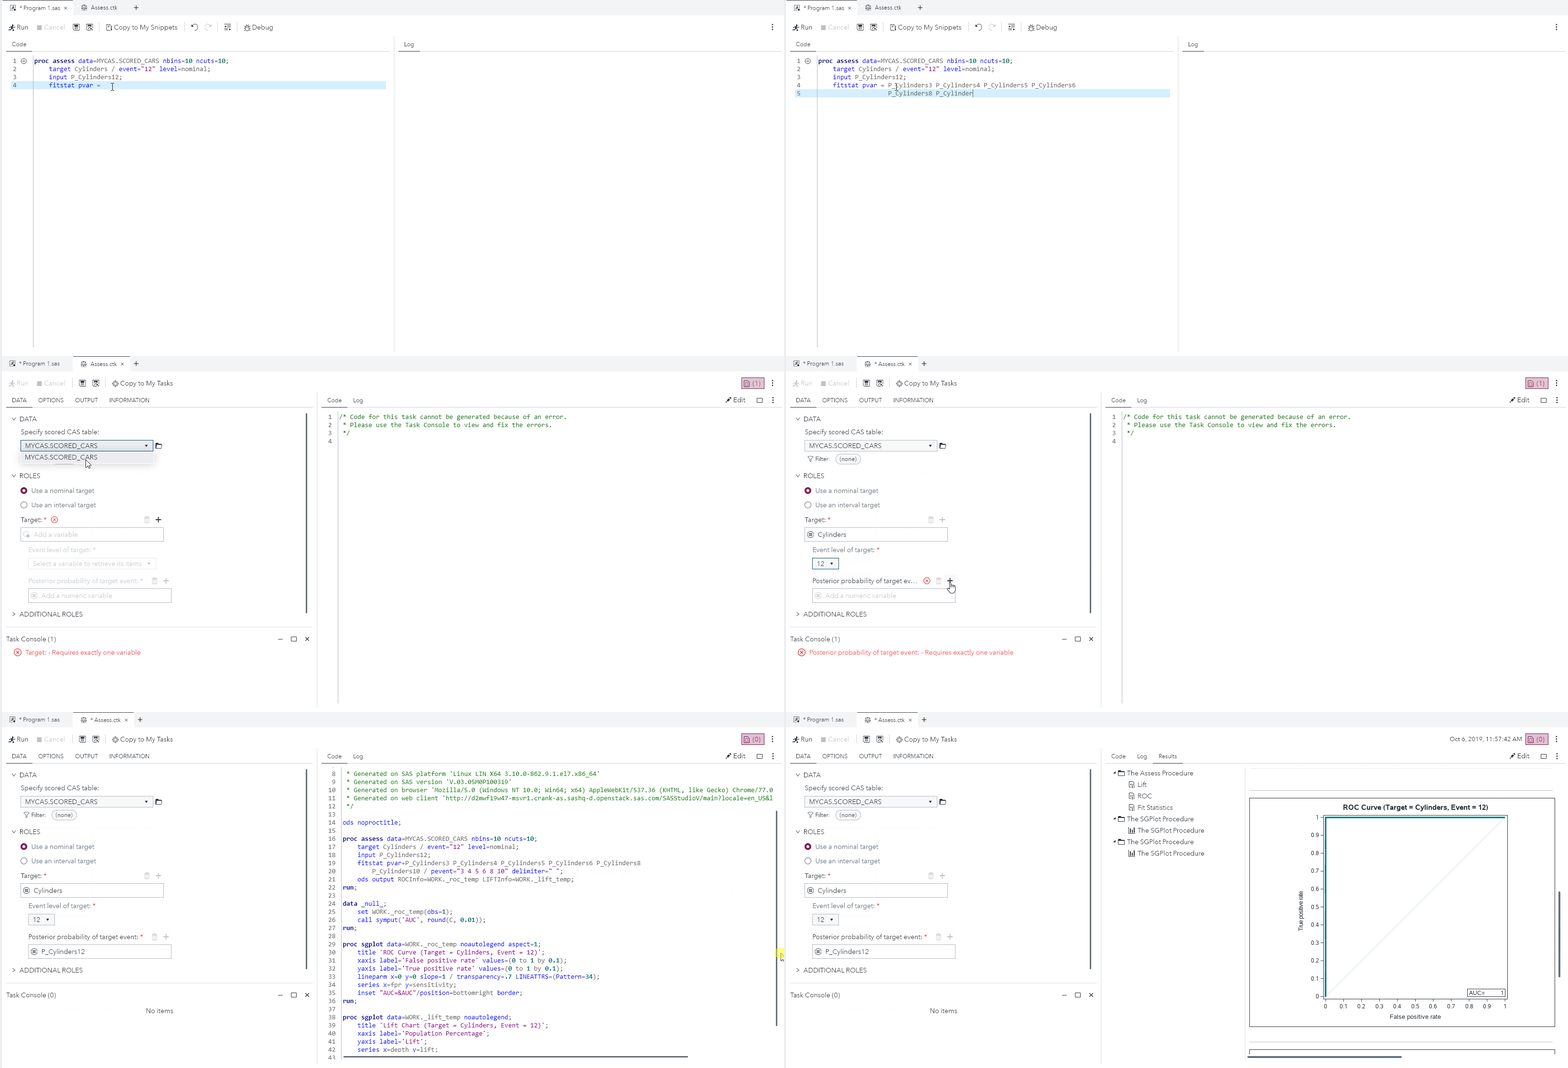
To see an incarnation of this framework at action, watch below animation to compare carrying out the same analytical task (assessing a trained model) with hand programming and point-n-click app.
Click on the image to see the full-sized version and click “Back” button of your browser to go back to this page.
Summary
Rapid Code Appification Framework is an emerging category. Just like Tableau’s value is at operationalizing data by democratizing data visualization, Code Appification Framework’ value is at operationalizing code by democratizing app development. Enterprise customers want to custom build their own data/analytic apps embodying their secrete sauce, without hiring HTML, CSS and JavaScript specialists. And they’re willing to pay money for it.
Existing Code Appification Framework didn’t get much traction because the connection between UI and code is tethered to one of the imperative programming languages such as Python or R. Whoever would break the tight coupling and implement usability features laid out in this blog will finally popularize and lead the category.
References
- As the pioneer in analytics app, Matlab now provides three different ways to build apps.
- Apache Pyodide brings Python stack directly into the browser, making Python implemented analytics apps more interactive(with all that saved round trips between app runtime and execution runtime).
- For the best data flow-based app framework, see Ab Initio, a system imagined and built by the folks of Thinking Machines.
Notes
[1]Consider that’s twenty years ago in Niskayuna, NY.⤴
[2]Who says only the Chinese steal intellectual properties by reverse engineering? I can testify there were at least six different competitor refrigerators on GE’s workshop floor, all dissected and measured.⤴
